| Param | Original file | Final file |
|---|---|---|
| Filename | modeM0/AS1A12_006T08_9000005378cztM0_level2.fits | modeM0/AS1A12_006T08_9000005378cztM0_level2_quad_clean.evt |
| Size (bytes) | 138,767,040 | 141,022,080 |
| Size | 132.3 MB | 134.5 MB |
| Events in quadrant A | 886,362 | 898,136 |
| Events in quadrant B | 852,978 | 908,304 |
| Events in quadrant C | 853,178 | 834,260 |
| Events in quadrant D | 646,668 | 667,538 |
| Mode M0 | |||
|---|---|---|---|
| Quadrant | BADHDUFLAG | Total packets | Discarded packets |
| A | 0 | 33046 | 0 |
| B | 0 | 31856 | 0 |
| C | 0 | 29453 | 0 |
| D | 0 | 82022 | 0 |
| Mode M9 | |||
|---|---|---|---|
| Quadrant | BADHDUFLAG | Total packets | Discarded packets |
| A | 0 | 76 | 0 |
| B | 0 | 76 | 0 |
| C | 0 | 76 | 0 |
| D | 0 | 76 | 0 |
| Mode SS | |||
|---|---|---|---|
| Quadrant | BADHDUFLAG | Total packets | Discarded packets |
| A | 0 | 284 | 0 |
| B | 0 | 282 | 0 |
| C | 0 | 286 | 0 |
| D | 0 | 286 | 0 |
| Quadrant | Total seconds | Saturated seconds | Saturation percentage |
|---|---|---|---|
| A | 13948 | 105 | 0.752796% |
| B | 13948 | 145 | 1.039576% |
| C | 13944 | 26 | 0.186460% |
| D | 13873 | 4247 | 30.613422% |
Noise dominated data is calculated using 1-second bins in cleaned event files. If a bin has >2000 counts, and if more than 50% of those come from <1% of pixels, then it is considered to be noise-dominated and hence unusable.
| Quadrant | # 1 sec bins | Bins with >0 counts | Bins with >2000 counts | High rate bins dominated by noise | Noise dominated (total time) | Noise dominated (detector-on time) | Marked lightcurve |
|---|---|---|---|---|---|---|---|
| A | 19986 | 14001 | 0 | 0 | 0.00% | 0.00% | 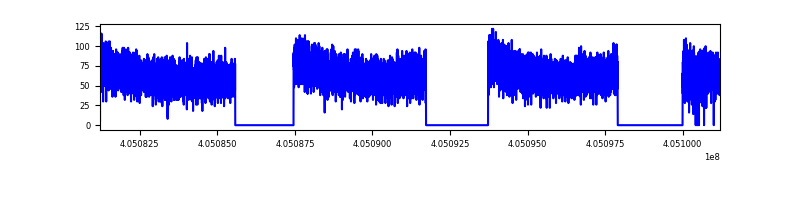 |
| B | 19986 | 13999 | 0 | 0 | 0.00% | 0.00% |  |
| C | 19986 | 13995 | 0 | 0 | 0.00% | 0.00% |  |
| D | 19987 | 13969 | 0 | 0 | 0.00% | 0.00% | 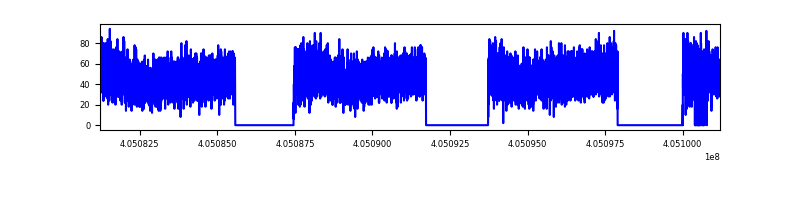 |
Top three noisy pixels from each quadrant. If the there are fewer than three noisy pixels in the level2.evt file, extra rows are filled as -1
| Pixel properties | Quadrant properties | ||||||
|---|---|---|---|---|---|---|---|
| Quadrant | DetID | PixID | Counts | Sigma | Mean | Median | Sigma |
| A | 0 | 29 | 717 | 8.67 | 231 | 218 | 57.5 |
| A | 7 | 110 | 709 | 8.53 | 231 | 218 | 57.5 |
| A | 9 | 19 | 691 | 8.22 | 231 | 218 | 57.5 |
| B | 2 | 9 | 701 | 10.61 | 226 | 217 | 45.6 |
| B | 3 | 80 | 658 | 9.67 | 226 | 217 | 45.6 |
| B | 5 | 128 | 612 | 8.66 | 226 | 217 | 45.6 |
| C | 3 | 202 | 673 | 7.8 | 225 | 213 | 59.0 |
| C | 1 | 80 | 669 | 7.73 | 225 | 213 | 59.0 |
| C | 3 | 203 | 632 | 7.1 | 225 | 213 | 59.0 |
| D | 6 | 83 | 481 | 6.26 | 184 | 170 | 49.7 |
| D | 6 | 67 | 480 | 6.24 | 184 | 170 | 49.7 |
| D | 1 | 3 | 473 | 6.1 | 184 | 170 | 49.7 |
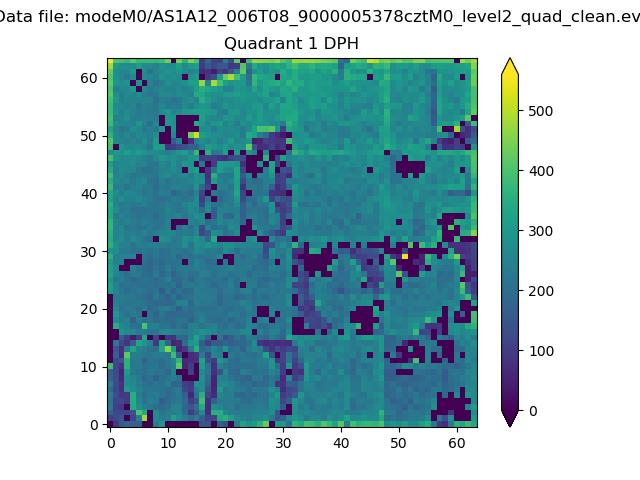
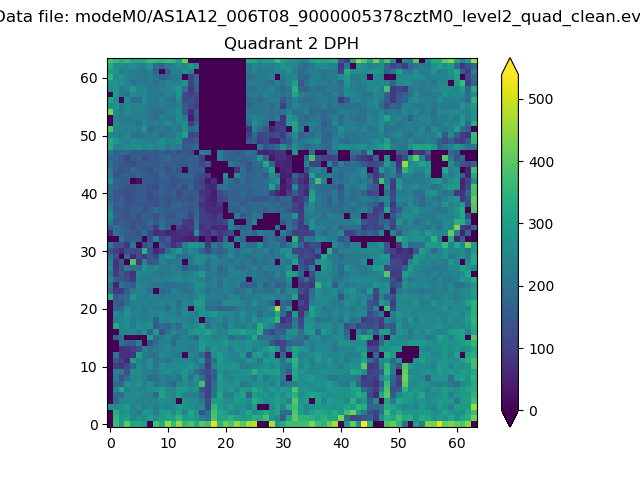
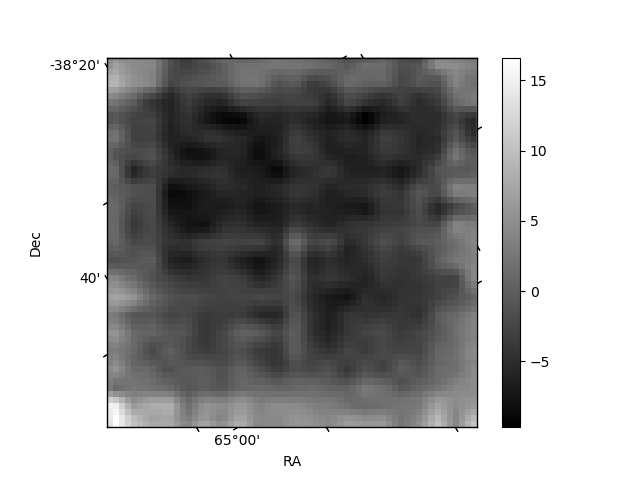
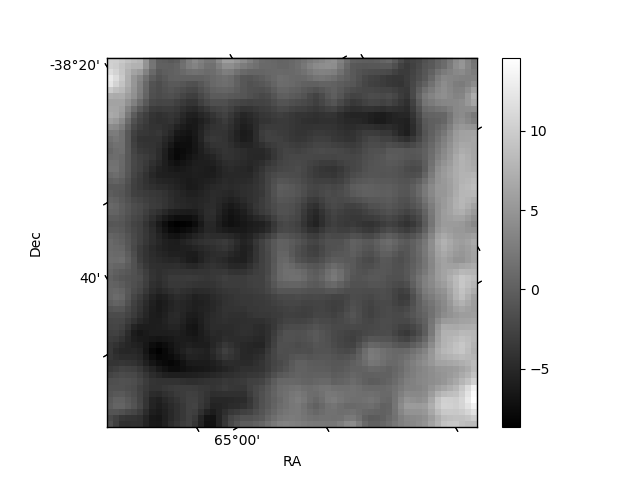
Histogram calculated using DETX and DETY for each event in the final _common_clean file
| Quadrant A |  |
 |
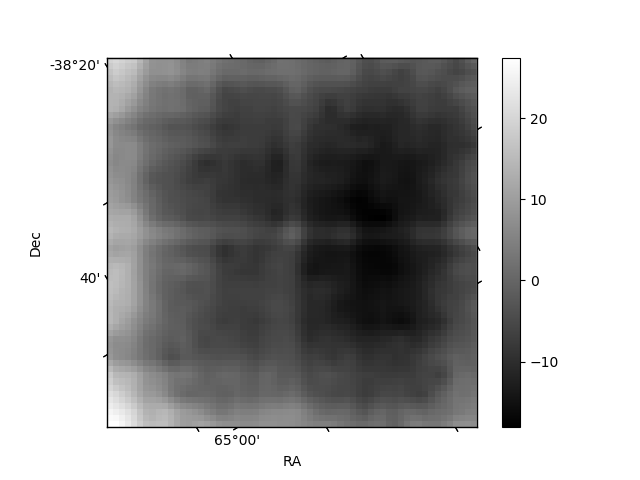
Quadrant B |
|---|---|---|---|
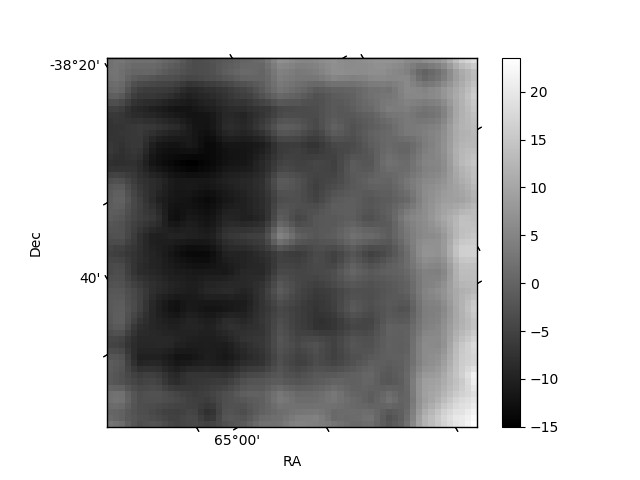
| Quadrant D |  |
 |
Quadrant C |
| Plot type | Count rate plots | Images |
|---|---|---|
| Comparison with Poisson distribution Blue bars denote a histogram of data divided into 1 sec bins. Red curve is a Poisson curve with rate = median count rate of data. |
 |
 |
| Quadrant-wise count rates Data is divided into 100 sec bins |
 |
|
| Module-wise count rates for Quadrant A Data is divided into 100 sec bins |
 |
 |
| Module-wise count rates for Quadrant B Data is divided into 100 sec bins |
 |
 |
| Module-wise count rates for Quadrant C Data is divided into 100 sec bins |
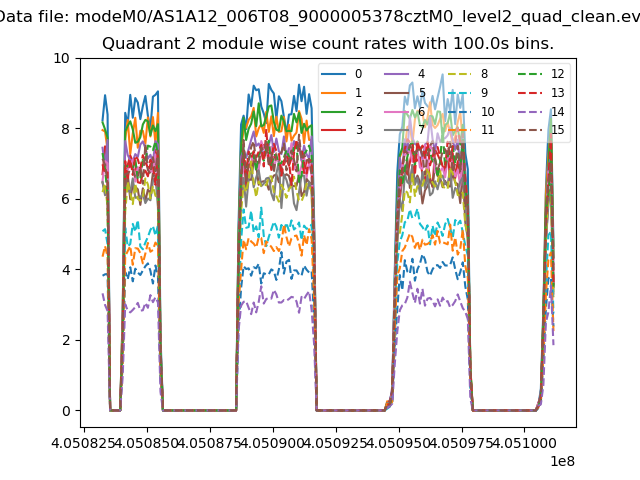 |
 |
| Module-wise count rates for Quadrant D Data is divided into 100 sec bins |
 |
 |
| Parameter | Plot |
|---|---|
| CZT HV Monitor | 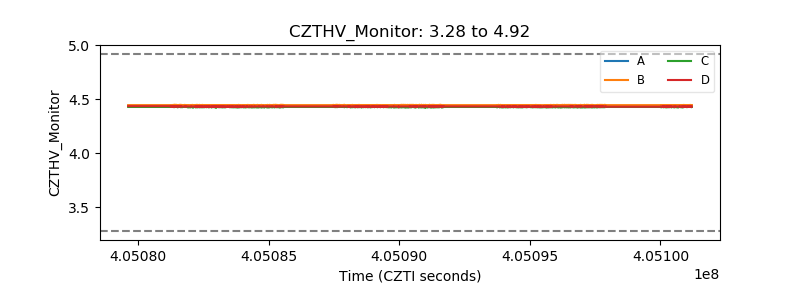 |
| D_VDD | 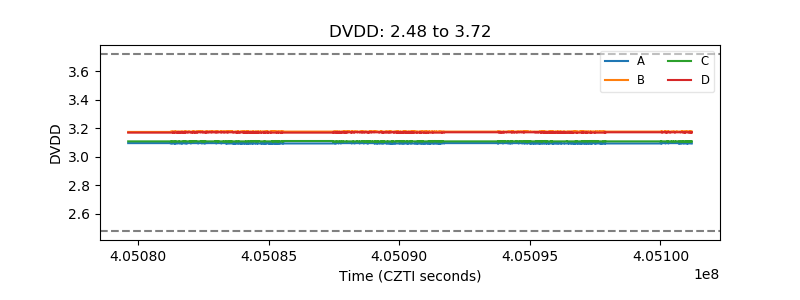 |
| Temperature 1 |  |
| Veto HV Monitor |  |
| Veto LLD |  |
| Alpha Counter |  |
| _CPM_Rate | 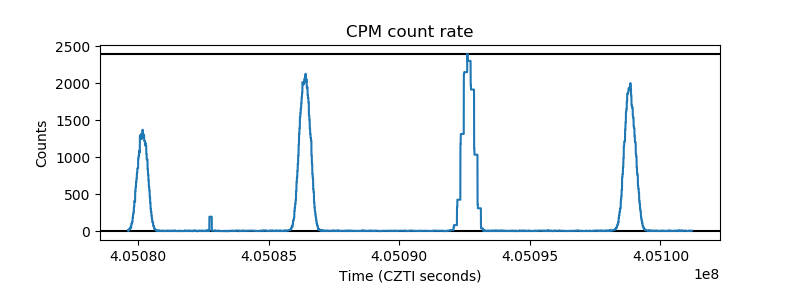 |
| CZT Counter |  |
| +2.5 Volts monitor |  |
| +5 Volts monitor |  |
| _ROLL_ROT |  |
| _Roll_DEC |  |
| _Roll_RA |  |
| Veto Counter |  |