| Param | Original file | Final file |
|---|---|---|
| Filename | modeM0/AS1A12_025T09_9000005382cztM0_level2.fits | modeM0/AS1A12_025T09_9000005382cztM0_level2_quad_clean.evt |
| Size (bytes) | 97,462,080 | 107,838,720 |
| Size | 92.9 MB | 102.8 MB |
| Events in quadrant A | 590,498 | 680,688 |
| Events in quadrant B | 568,076 | 681,860 |
| Events in quadrant C | 579,308 | 628,685 |
| Events in quadrant D | 468,286 | 529,017 |
| Mode M9 | |||
|---|---|---|---|
| Quadrant | BADHDUFLAG | Total packets | Discarded packets |
| A | 0 | 58 | 0 |
| B | 0 | 58 | 0 |
| C | 0 | 58 | 0 |
| D | 0 | 58 | 0 |
| Mode M0 | |||
|---|---|---|---|
| Quadrant | BADHDUFLAG | Total packets | Discarded packets |
| A | 0 | 23687 | 0 |
| B | 0 | 25834 | 0 |
| C | 0 | 23199 | 0 |
| D | 0 | 46708 | 0 |
| Mode SS | |||
|---|---|---|---|
| Quadrant | BADHDUFLAG | Total packets | Discarded packets |
| A | 0 | 220 | 0 |
| B | 0 | 220 | 0 |
| C | 0 | 220 | 0 |
| D | 0 | 220 | 0 |
| Quadrant | Total seconds | Saturated seconds | Saturation percentage |
|---|---|---|---|
| A | 10765 | 43 | 0.399443% |
| B | 10765 | 102 | 0.947515% |
| C | 10765 | 138 | 1.281932% |
| D | 10765 | 1190 | 11.054343% |
Noise dominated data is calculated using 1-second bins in cleaned event files. If a bin has >2000 counts, and if more than 50% of those come from <1% of pixels, then it is considered to be noise-dominated and hence unusable.
| Quadrant | # 1 sec bins | Bins with >0 counts | Bins with >2000 counts | High rate bins dominated by noise | Noise dominated (total time) | Noise dominated (detector-on time) | Marked lightcurve |
|---|---|---|---|---|---|---|---|
| A | 16504 | 10763 | 0 | 0 | 0.00% | 0.00% |  |
| B | 16504 | 10766 | 0 | 0 | 0.00% | 0.00% |  |
| C | 16504 | 10765 | 0 | 0 | 0.00% | 0.00% |  |
| D | 16504 | 10763 | 0 | 0 | 0.00% | 0.00% |  |
Top three noisy pixels from each quadrant. If the there are fewer than three noisy pixels in the level2.evt file, extra rows are filled as -1
| Pixel properties | Quadrant properties | ||||||
|---|---|---|---|---|---|---|---|
| Quadrant | DetID | PixID | Counts | Sigma | Mean | Median | Sigma |
| A | 0 | 29 | 477 | 8.22 | 154 | 146 | 40.3 |
| A | 14 | 95 | 458 | 7.75 | 154 | 146 | 40.3 |
| A | 7 | 110 | 458 | 7.75 | 154 | 146 | 40.3 |
| B | 2 | 9 | 483 | 10.89 | 150 | 143 | 31.2 |
| B | 3 | 80 | 440 | 9.52 | 150 | 143 | 31.2 |
| B | 5 | 255 | 431 | 9.23 | 150 | 143 | 31.2 |
| C | 1 | 81 | 492 | 8.56 | 153 | 144 | 40.6 |
| C | 1 | 80 | 434 | 7.14 | 153 | 144 | 40.6 |
| C | 1 | 65 | 431 | 7.06 | 153 | 144 | 40.6 |
| D | 7 | 3 | 371 | 6.7 | 134 | 122 | 37.2 |
| D | 6 | 38 | 336 | 5.75 | 134 | 122 | 37.2 |
| D | 10 | 113 | 329 | 5.57 | 134 | 122 | 37.2 |
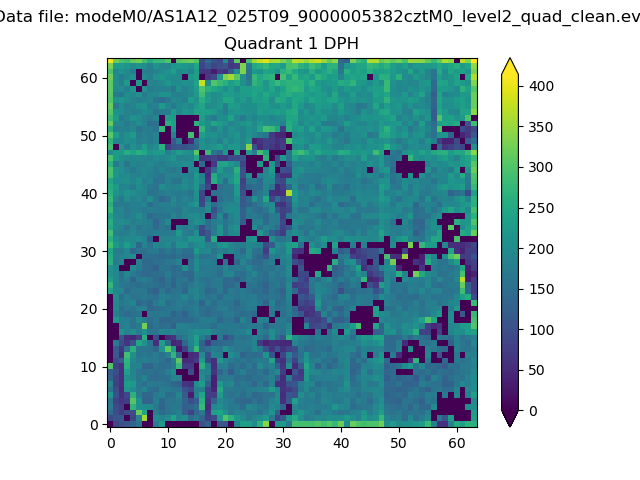
Histogram calculated using DETX and DETY for each event in the final _common_clean file
| Quadrant A |  |
 |
Quadrant B |
|---|---|---|---|
| Quadrant D | 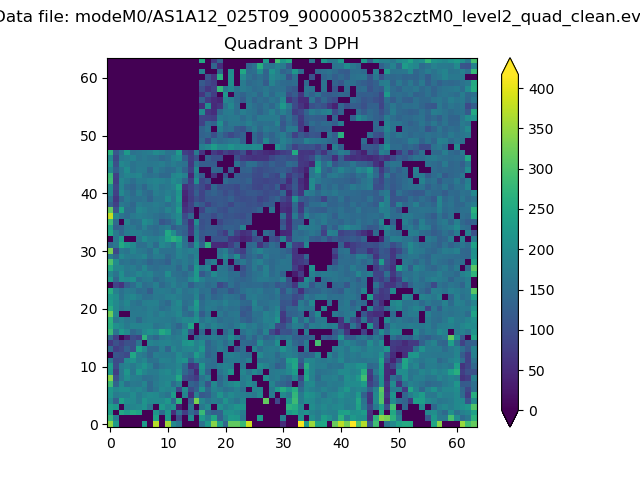 |
 |
Quadrant C |
| Plot type | Count rate plots | Images |
|---|---|---|
| Comparison with Poisson distribution Blue bars denote a histogram of data divided into 1 sec bins. Red curve is a Poisson curve with rate = median count rate of data. |
 |
 |
| Quadrant-wise count rates Data is divided into 100 sec bins |
 |
|
| Module-wise count rates for Quadrant A Data is divided into 100 sec bins |
 |
 |
| Module-wise count rates for Quadrant B Data is divided into 100 sec bins |
 |
 |
| Module-wise count rates for Quadrant C Data is divided into 100 sec bins |
 |
 |
| Module-wise count rates for Quadrant D Data is divided into 100 sec bins |
 |
 |
| Parameter | Plot |
|---|---|
| CZT HV Monitor |  |
| D_VDD |  |
| Temperature 1 |  |
| Veto HV Monitor | 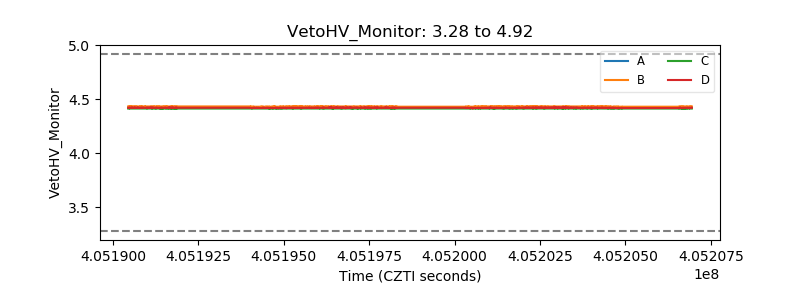 |
| Veto LLD |  |
| Alpha Counter |  |
| _CPM_Rate | 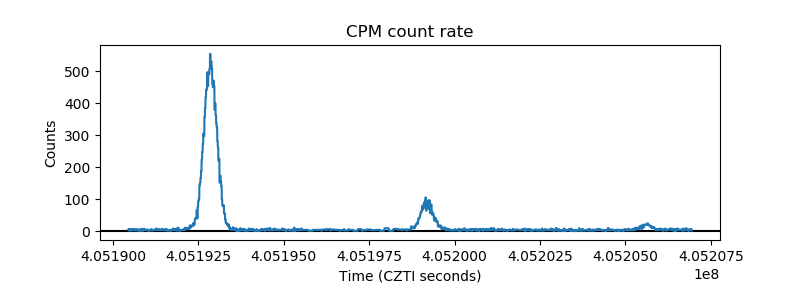 |
| CZT Counter |  |
| +2.5 Volts monitor |  |
| +5 Volts monitor | 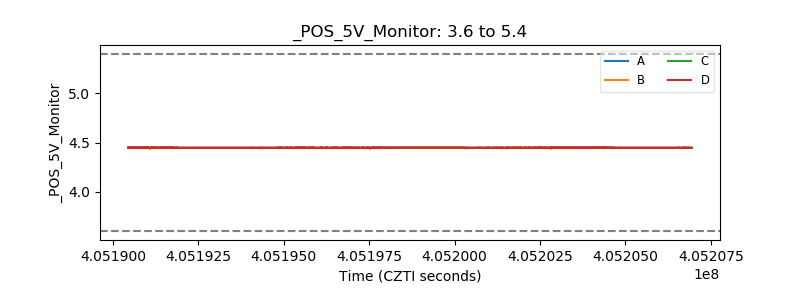 |
| _ROLL_ROT |  |
| _Roll_DEC |  |
| _Roll_RA |  |
| Veto Counter |  |