| Param | Original file | Final file |
|---|---|---|
| Filename | modeM0/AS1A12_018T01_9000005386cztM0_level2.fits | modeM0/AS1A12_018T01_9000005386cztM0_level2_quad_clean.evt |
| Size (bytes) | 52,551,360 | 79,430,400 |
| Size | 50.1 MB | 75.8 MB |
| Events in quadrant A | 318,920 | 550,469 |
| Events in quadrant B | 304,644 | 545,522 |
| Events in quadrant C | 302,762 | 487,607 |
| Events in quadrant D | 247,986 | 404,578 |
| Mode SS | |||
|---|---|---|---|
| Quadrant | BADHDUFLAG | Total packets | Discarded packets |
| A | 0 | 120 | 0 |
| B | 0 | 120 | 0 |
| C | 0 | 120 | 0 |
| D | 0 | 120 | 0 |
| Mode M9 | |||
|---|---|---|---|
| Quadrant | BADHDUFLAG | Total packets | Discarded packets |
| A | 0 | 16 | 0 |
| B | 0 | 16 | 0 |
| C | 0 | 16 | 0 |
| D | 0 | 17 | 0 |
| Mode M0 | |||
|---|---|---|---|
| Quadrant | BADHDUFLAG | Total packets | Discarded packets |
| A | 0 | 12893 | 0 |
| B | 0 | 12944 | 0 |
| C | 0 | 17186 | 0 |
| D | 0 | 22158 | 0 |
| Quadrant | Total seconds | Saturated seconds | Saturation percentage |
|---|---|---|---|
| A | 5970 | 20 | 0.335008% |
| B | 5970 | 93 | 1.557789% |
| C | 5970 | 339 | 5.678392% |
| D | 5970 | 1025 | 17.169179% |
Noise dominated data is calculated using 1-second bins in cleaned event files. If a bin has >2000 counts, and if more than 50% of those come from <1% of pixels, then it is considered to be noise-dominated and hence unusable.
| Quadrant | # 1 sec bins | Bins with >0 counts | Bins with >2000 counts | High rate bins dominated by noise | Noise dominated (total time) | Noise dominated (detector-on time) | Marked lightcurve |
|---|---|---|---|---|---|---|---|
| A | 7252 | 5969 | 0 | 0 | 0.00% | 0.00% |  |
| B | 7252 | 5968 | 0 | 0 | 0.00% | 0.00% |  |
| C | 7252 | 5969 | 0 | 0 | 0.00% | 0.00% |  |
| D | 7252 | 5967 | 0 | 0 | 0.00% | 0.00% |  |
Top three noisy pixels from each quadrant. If the there are fewer than three noisy pixels in the level2.evt file, extra rows are filled as -1
| Pixel properties | Quadrant properties | ||||||
|---|---|---|---|---|---|---|---|
| Quadrant | DetID | PixID | Counts | Sigma | Mean | Median | Sigma |
| A | 0 | 29 | 269 | 8.42 | 83 | 78 | 22.7 |
| A | 7 | 110 | 267 | 8.33 | 83 | 78 | 22.7 |
| A | 9 | 19 | 267 | 8.33 | 83 | 78 | 22.7 |
| B | 5 | 255 | 248 | 9.32 | 80 | 77 | 18.4 |
| B | 2 | 9 | 238 | 8.77 | 80 | 77 | 18.4 |
| B | 3 | 80 | 228 | 8.23 | 80 | 77 | 18.4 |
| C | 1 | 81 | 254 | 8.14 | 79 | 74 | 22.1 |
| C | 3 | 203 | 244 | 7.69 | 79 | 74 | 22.1 |
| C | 3 | 202 | 216 | 6.42 | 79 | 74 | 22.1 |
| D | 11 | 66 | 189 | 6.07 | 70 | 64 | 20.6 |
| D | 6 | 67 | 188 | 6.02 | 70 | 64 | 20.6 |
| D | 6 | 231 | 186 | 5.93 | 70 | 64 | 20.6 |
Histogram calculated using DETX and DETY for each event in the final _common_clean file
| Quadrant A |  |
 |
Quadrant B |
|---|---|---|---|
| Quadrant D |  |
 |
Quadrant C |
| Plot type | Count rate plots | Images |
|---|---|---|
| Comparison with Poisson distribution Blue bars denote a histogram of data divided into 1 sec bins. Red curve is a Poisson curve with rate = median count rate of data. |
 |
 |
| Quadrant-wise count rates Data is divided into 100 sec bins |
 |
|
| Module-wise count rates for Quadrant A Data is divided into 100 sec bins |
 |
 |
| Module-wise count rates for Quadrant B Data is divided into 100 sec bins |
 |
 |
| Module-wise count rates for Quadrant C Data is divided into 100 sec bins |
 |
 |
| Module-wise count rates for Quadrant D Data is divided into 100 sec bins |
 |
 |
| Parameter | Plot |
|---|---|
| CZT HV Monitor |  |
| D_VDD | 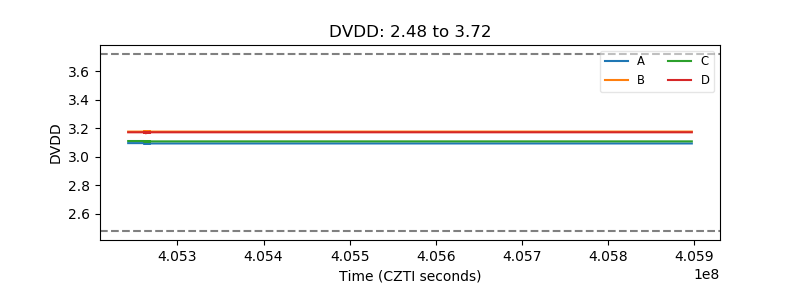 |
| Temperature 1 |  |
| Veto HV Monitor |  |
| Veto LLD | 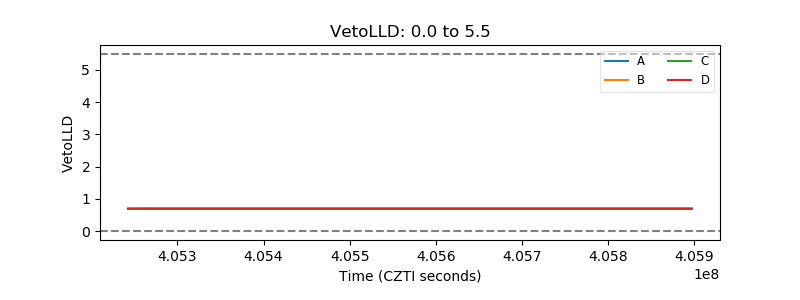 |
| Alpha Counter |  |
| _CPM_Rate |  |
| CZT Counter | 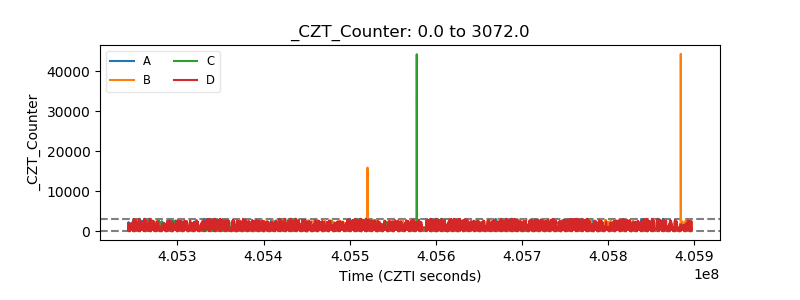 |
| +2.5 Volts monitor |  |
| +5 Volts monitor | 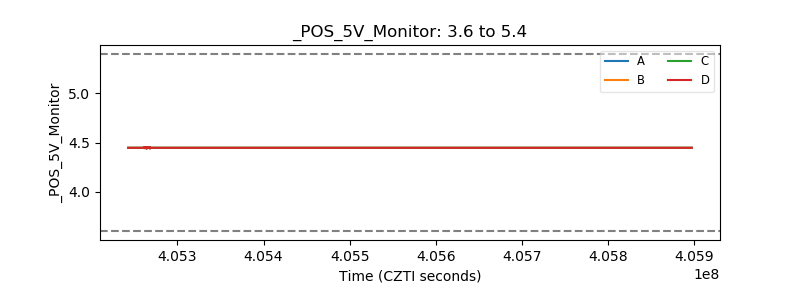 |
| _ROLL_ROT | 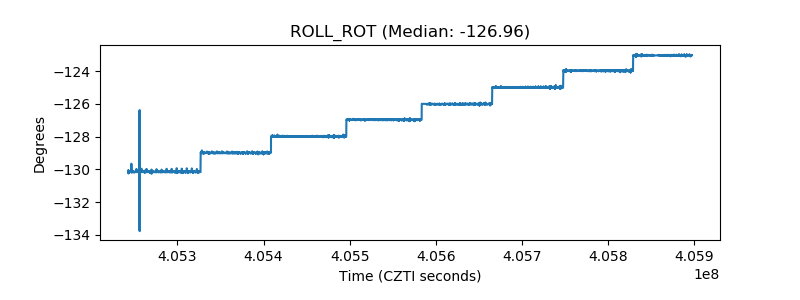 |
| _Roll_DEC |  |
| _Roll_RA | 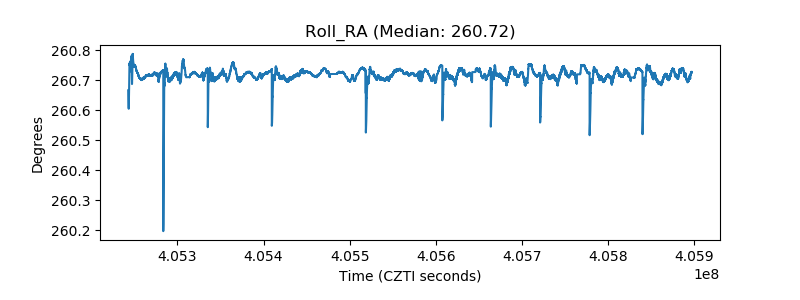 |
| Veto Counter |  |