| Param | Original file | Final file |
|---|---|---|
| Filename | modeM0/AS1A12_052T04_9000005388cztM0_level2.fits | modeM0/AS1A12_052T04_9000005388cztM0_level2_quad_clean.evt |
| Size (bytes) | 1,408,487,040 | 1,572,226,560 |
| Size | 1.3 GB | 1.5 GB |
| Events in quadrant A | 8,748,468 | 10,187,967 |
| Events in quadrant B | 8,177,248 | 9,728,073 |
| Events in quadrant C | 8,481,842 | 9,721,470 |
| Events in quadrant D | 6,878,972 | 7,622,021 |
| Mode M0 | |||
|---|---|---|---|
| Quadrant | BADHDUFLAG | Total packets | Discarded packets |
| A | 0 | 333165 | 0 |
| B | 0 | 408095 | 0 |
| C | 0 | 371036 | 0 |
| D | 0 | 567956 | 0 |
| Mode SS | |||
|---|---|---|---|
| Quadrant | BADHDUFLAG | Total packets | Discarded packets |
| A | 0 | 3090 | 0 |
| B | 0 | 3090 | 0 |
| C | 0 | 3090 | 0 |
| D | 0 | 3090 | 0 |
| Mode M9 | |||
|---|---|---|---|
| Quadrant | BADHDUFLAG | Total packets | Discarded packets |
| A | 0 | 592 | 0 |
| B | 0 | 592 | 0 |
| C | 0 | 592 | 0 |
| D | 0 | 593 | 0 |
| Quadrant | Total seconds | Saturated seconds | Saturation percentage |
|---|---|---|---|
| A | 151168 | 851 | 0.562950% |
| B | 151168 | 7665 | 5.070518% |
| C | 151168 | 3209 | 2.122804% |
| D | 151168 | 21185 | 14.014209% |
Noise dominated data is calculated using 1-second bins in cleaned event files. If a bin has >2000 counts, and if more than 50% of those come from <1% of pixels, then it is considered to be noise-dominated and hence unusable.
| Quadrant | # 1 sec bins | Bins with >0 counts | Bins with >2000 counts | High rate bins dominated by noise | Noise dominated (total time) | Noise dominated (detector-on time) | Marked lightcurve |
|---|---|---|---|---|---|---|---|
| A | 209633 | 151152 | 0 | 0 | 0.00% | 0.00% | 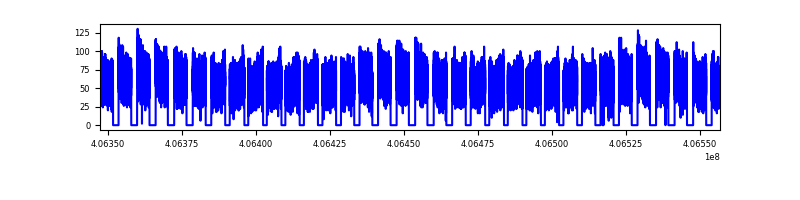 |
| B | 209633 | 151038 | 0 | 0 | 0.00% | 0.00% |  |
| C | 209633 | 151142 | 0 | 0 | 0.00% | 0.00% | 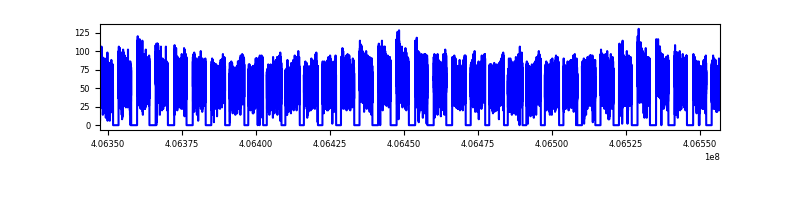 |
| D | 209633 | 150916 | 0 | 0 | 0.00% | 0.00% |  |
Top three noisy pixels from each quadrant. If the there are fewer than three noisy pixels in the level2.evt file, extra rows are filled as -1
| Pixel properties | Quadrant properties | ||||||
|---|---|---|---|---|---|---|---|
| Quadrant | DetID | PixID | Counts | Sigma | Mean | Median | Sigma |
| A | 7 | 110 | 7166 | 9.0 | 2291 | 2168 | 555.3 |
| A | 0 | 29 | 7109 | 8.9 | 2291 | 2168 | 555.3 |
| A | 9 | 19 | 7059 | 8.81 | 2291 | 2168 | 555.3 |
| B | 2 | 9 | 6964 | 11.78 | 2170 | 2082 | 414.5 |
| B | 3 | 80 | 6281 | 10.13 | 2170 | 2082 | 414.5 |
| B | 5 | 255 | 5726 | 8.79 | 2170 | 2082 | 414.5 |
| C | 1 | 81 | 6976 | 8.71 | 2246 | 2122 | 557.4 |
| C | 3 | 202 | 6814 | 8.42 | 2246 | 2122 | 557.4 |
| C | 1 | 80 | 6783 | 8.36 | 2246 | 2122 | 557.4 |
| D | 10 | 189 | 5037 | 6.24 | 1977 | 1810 | 517.2 |
| D | 7 | 3 | 5016 | 6.2 | 1977 | 1810 | 517.2 |
| D | 4 | 160 | 4964 | 6.1 | 1977 | 1810 | 517.2 |
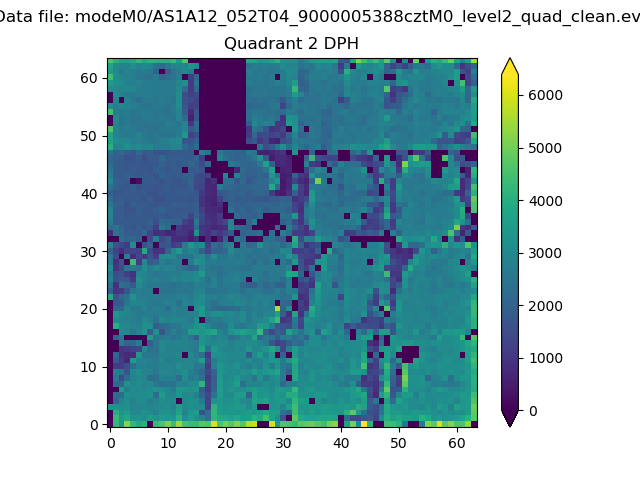
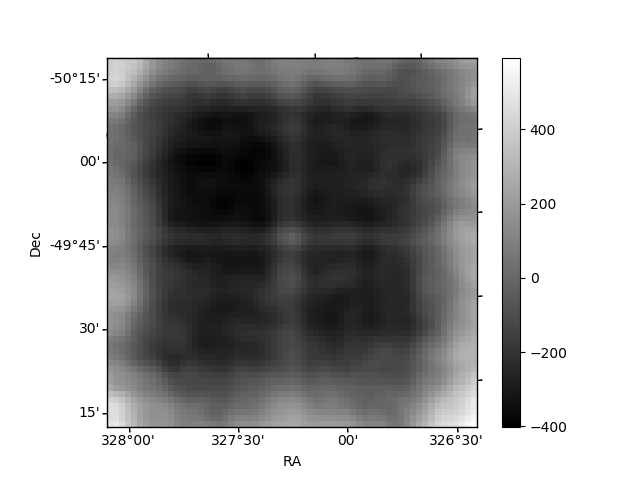
Histogram calculated using DETX and DETY for each event in the final _common_clean file
| Quadrant A | 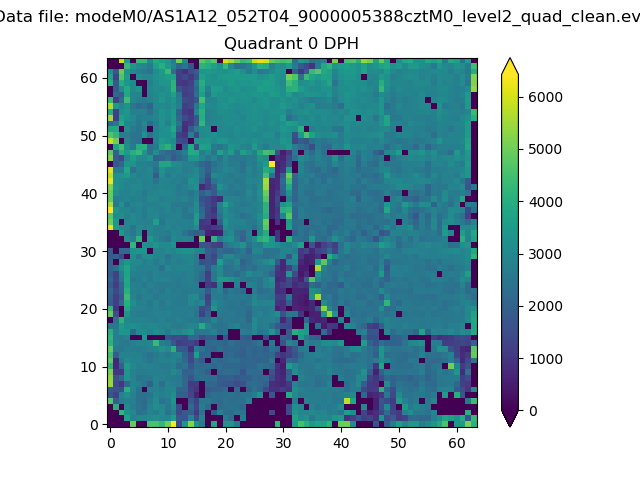 |
 |
Quadrant B |
|---|---|---|---|
| Quadrant D |  |
 |
Quadrant C |
| Plot type | Count rate plots | Images |
|---|---|---|
| Comparison with Poisson distribution Blue bars denote a histogram of data divided into 1 sec bins. Red curve is a Poisson curve with rate = median count rate of data. |
 |
 |
| Quadrant-wise count rates Data is divided into 100 sec bins |
 |
|
| Module-wise count rates for Quadrant A Data is divided into 100 sec bins |
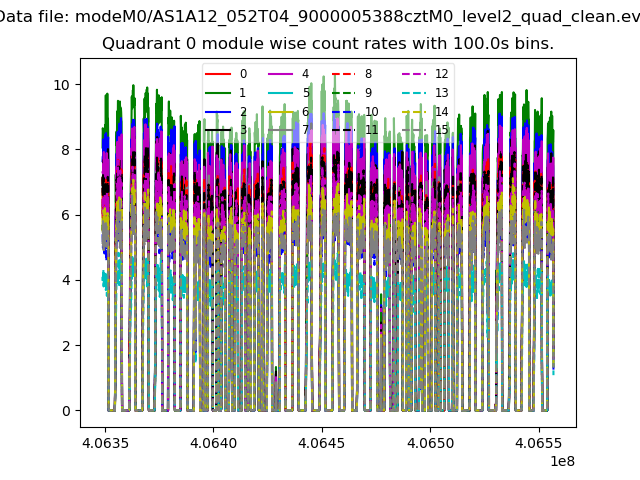 |
 |
| Module-wise count rates for Quadrant B Data is divided into 100 sec bins |
 |
 |
| Module-wise count rates for Quadrant C Data is divided into 100 sec bins |
 |
 |
| Module-wise count rates for Quadrant D Data is divided into 100 sec bins |
 |
 |
| Parameter | Plot |
|---|---|
| CZT HV Monitor |  |
| D_VDD |  |
| Temperature 1 |  |
| Veto HV Monitor | 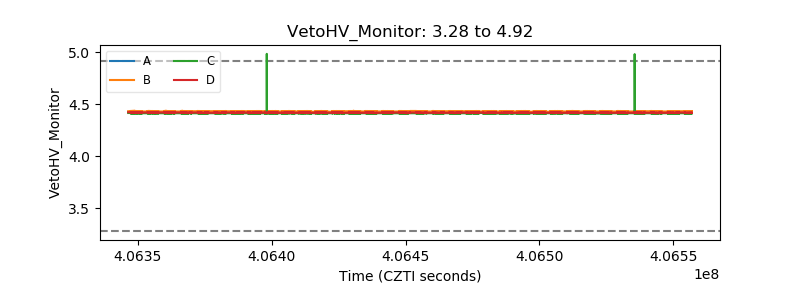 |
| Veto LLD | 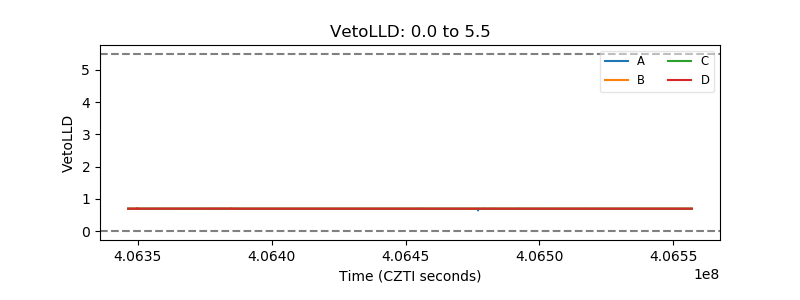 |
| Alpha Counter |  |
| _CPM_Rate |  |
| CZT Counter |  |
| +2.5 Volts monitor |  |
| +5 Volts monitor |  |
| _ROLL_ROT |  |
| _Roll_DEC |  |
| _Roll_RA | 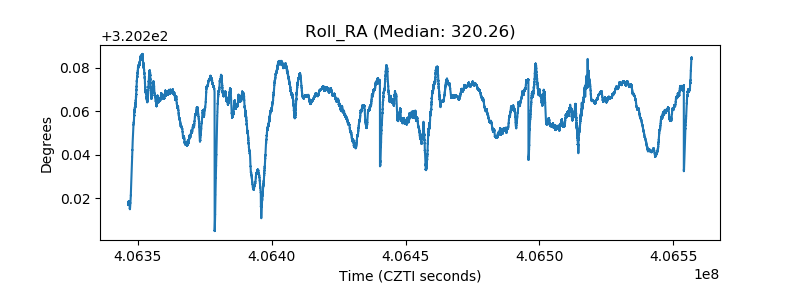 |
| Veto Counter |  |