| Param | Original file | Final file |
|---|---|---|
| Filename | modeM0/AS1A12_051T01_9000005394cztM0_level2.fits | modeM0/AS1A12_051T01_9000005394cztM0_level2_quad_clean.evt |
| Size (bytes) | 1,183,144,320 | 1,175,503,680 |
| Size | 1.1 GB | 1.1 GB |
| Events in quadrant A | 7,096,870 | 7,065,063 |
| Events in quadrant B | 6,842,228 | 6,944,098 |
| Events in quadrant C | 6,987,318 | 6,619,657 |
| Events in quadrant D | 5,976,460 | 6,045,860 |
| Mode SS | |||
|---|---|---|---|
| Quadrant | BADHDUFLAG | Total packets | Discarded packets |
| A | 0 | 2660 | 0 |
| B | 0 | 2660 | 0 |
| C | 0 | 2660 | 0 |
| D | 0 | 2660 | 0 |
| Mode M0 | |||
|---|---|---|---|
| Quadrant | BADHDUFLAG | Total packets | Discarded packets |
| A | 0 | 277793 | 0 |
| B | 0 | 292316 | 0 |
| C | 0 | 284127 | 0 |
| D | 0 | 343193 | 0 |
| Mode M9 | |||
|---|---|---|---|
| Quadrant | BADHDUFLAG | Total packets | Discarded packets |
| A | 0 | 489 | 0 |
| B | 0 | 488 | 0 |
| C | 0 | 488 | 0 |
| D | 0 | 489 | 0 |
| Quadrant | Total seconds | Saturated seconds | Saturation percentage |
|---|---|---|---|
| A | 130273 | 492 | 0.377668% |
| B | 130273 | 3161 | 2.426443% |
| C | 130273 | 1795 | 1.377876% |
| D | 130273 | 4563 | 3.502644% |
Noise dominated data is calculated using 1-second bins in cleaned event files. If a bin has >2000 counts, and if more than 50% of those come from <1% of pixels, then it is considered to be noise-dominated and hence unusable.
| Quadrant | # 1 sec bins | Bins with >0 counts | Bins with >2000 counts | High rate bins dominated by noise | Noise dominated (total time) | Noise dominated (detector-on time) | Marked lightcurve |
|---|---|---|---|---|---|---|---|
| A | 178015 | 130272 | 0 | 0 | 0.00% | 0.00% |  |
| B | 178015 | 130252 | 0 | 0 | 0.00% | 0.00% |  |
| C | 178015 | 130230 | 0 | 0 | 0.00% | 0.00% | 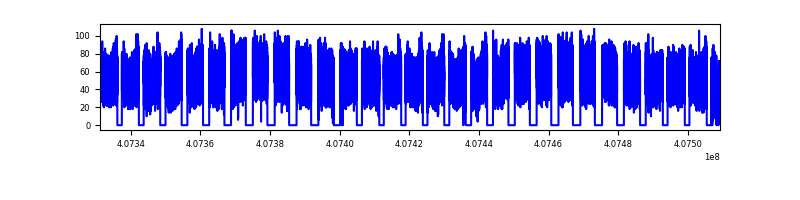 |
| D | 178015 | 130160 | 0 | 0 | 0.00% | 0.00% |  |
Top three noisy pixels from each quadrant. If the there are fewer than three noisy pixels in the level2.evt file, extra rows are filled as -1
| Pixel properties | Quadrant properties | ||||||
|---|---|---|---|---|---|---|---|
| Quadrant | DetID | PixID | Counts | Sigma | Mean | Median | Sigma |
| A | 7 | 110 | 5887 | 8.87 | 1854 | 1730 | 468.9 |
| A | 9 | 19 | 5844 | 8.77 | 1854 | 1730 | 468.9 |
| A | 0 | 29 | 5672 | 8.41 | 1854 | 1730 | 468.9 |
| B | 2 | 9 | 5897 | 11.9 | 1804 | 1718 | 351.2 |
| B | 3 | 80 | 5409 | 10.51 | 1804 | 1718 | 351.2 |
| B | 3 | 17 | 4724 | 8.56 | 1804 | 1718 | 351.2 |
| C | 1 | 81 | 5720 | 8.53 | 1846 | 1734 | 467.4 |
| C | 1 | 80 | 5563 | 8.19 | 1846 | 1734 | 467.4 |
| C | 3 | 202 | 5541 | 8.14 | 1846 | 1734 | 467.4 |
| D | 7 | 3 | 4476 | 6.46 | 1706 | 1558 | 451.6 |
| D | 10 | 189 | 4426 | 6.35 | 1706 | 1558 | 451.6 |
| D | 10 | 113 | 4321 | 6.12 | 1706 | 1558 | 451.6 |
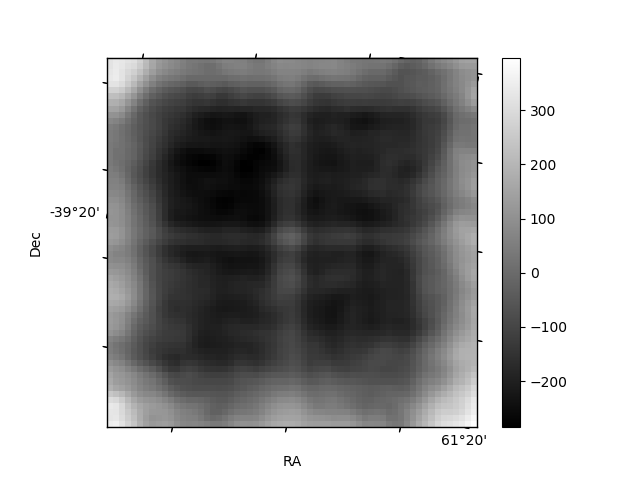
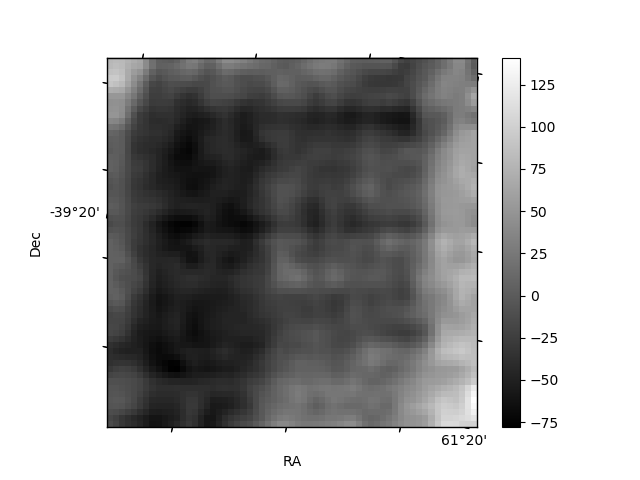
Histogram calculated using DETX and DETY for each event in the final _common_clean file
| Quadrant A | 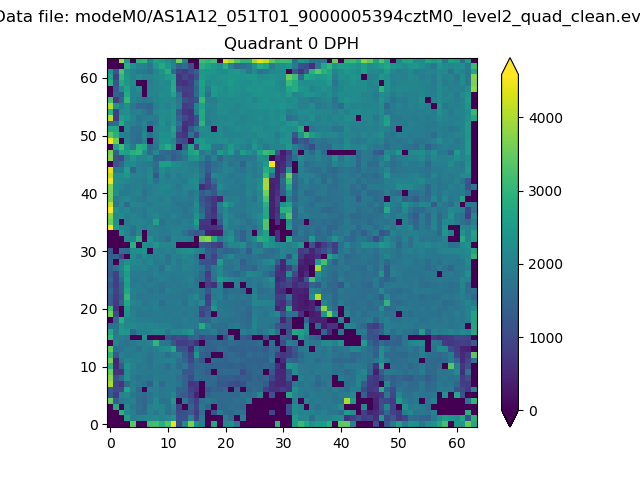 |
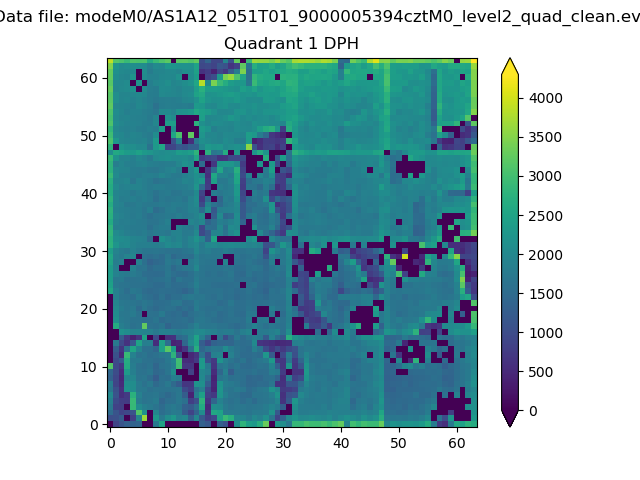 |
Quadrant B |
|---|---|---|---|
| Quadrant D |  |
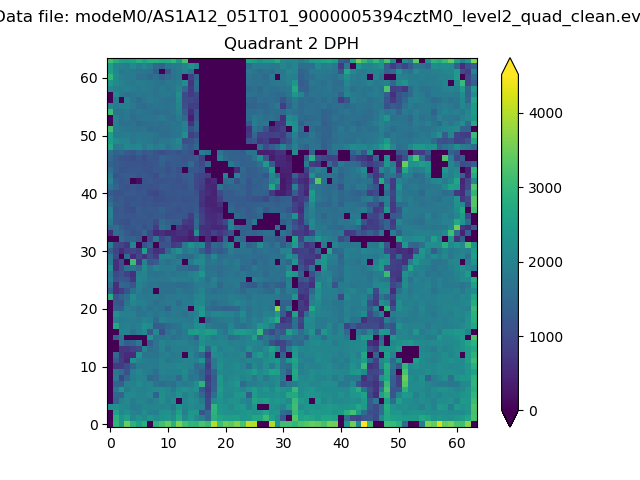 |
Quadrant C |
| Plot type | Count rate plots | Images |
|---|---|---|
| Comparison with Poisson distribution Blue bars denote a histogram of data divided into 1 sec bins. Red curve is a Poisson curve with rate = median count rate of data. |
 |
 |
| Quadrant-wise count rates Data is divided into 100 sec bins |
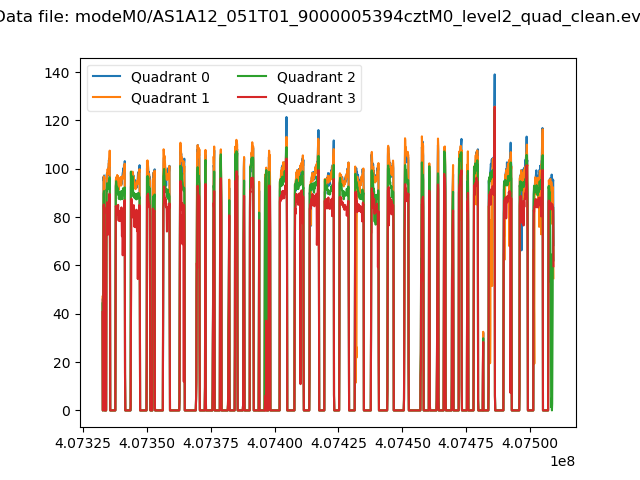 |
|
| Module-wise count rates for Quadrant A Data is divided into 100 sec bins |
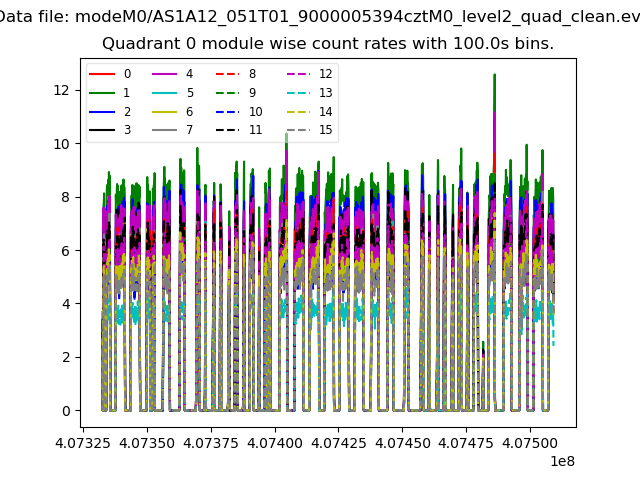 |
 |
| Module-wise count rates for Quadrant B Data is divided into 100 sec bins |
 |
 |
| Module-wise count rates for Quadrant C Data is divided into 100 sec bins |
 |
 |
| Module-wise count rates for Quadrant D Data is divided into 100 sec bins |
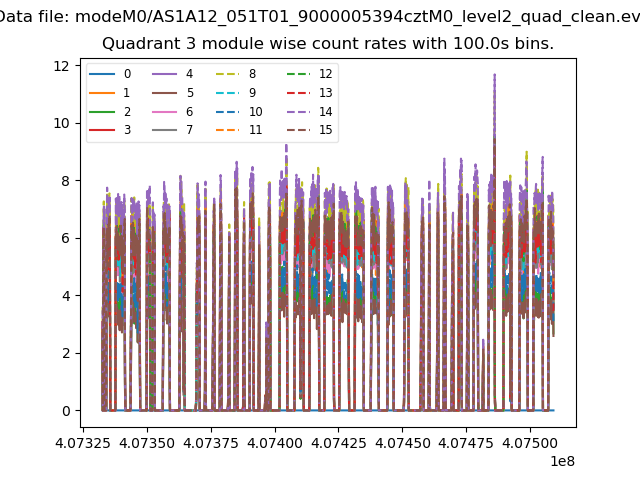 |
 |
| Parameter | Plot |
|---|---|
| CZT HV Monitor |  |
| D_VDD |  |
| Temperature 1 | 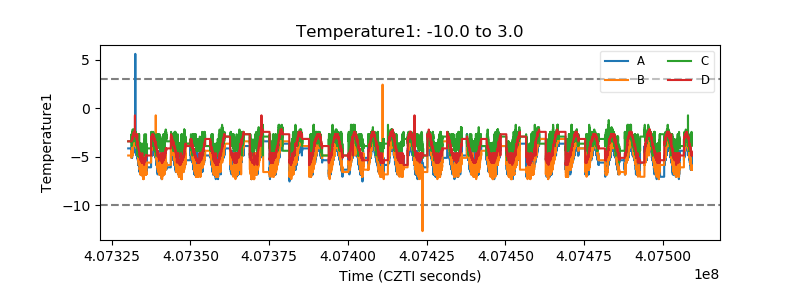 |
| Veto HV Monitor |  |
| Veto LLD |  |
| Alpha Counter | 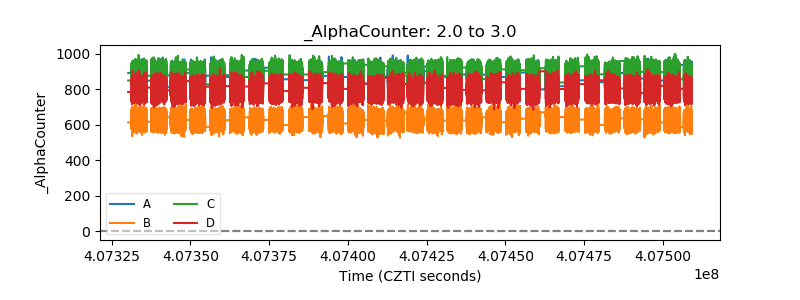 |
| _CPM_Rate | 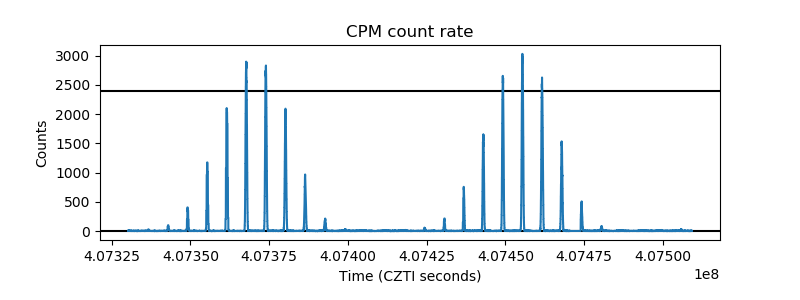 |
| CZT Counter | 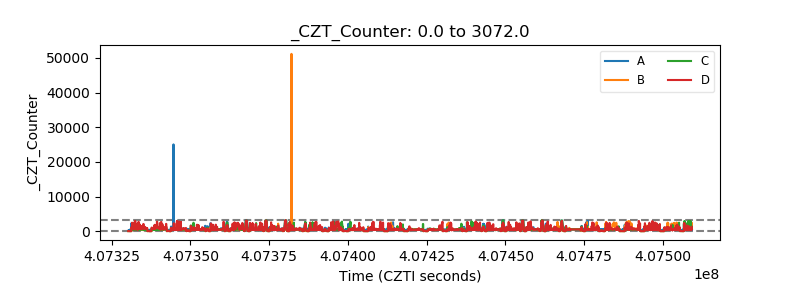 |
| +2.5 Volts monitor | 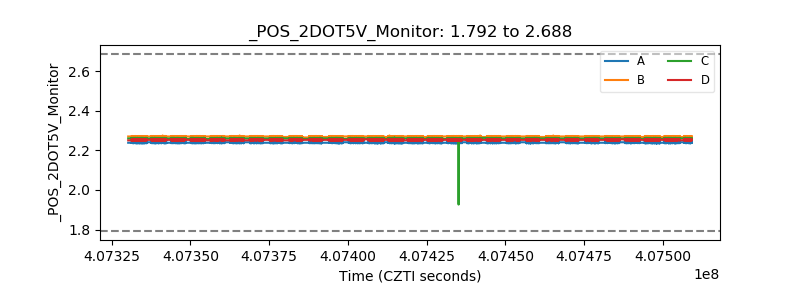 |
| +5 Volts monitor |  |
| _ROLL_ROT | 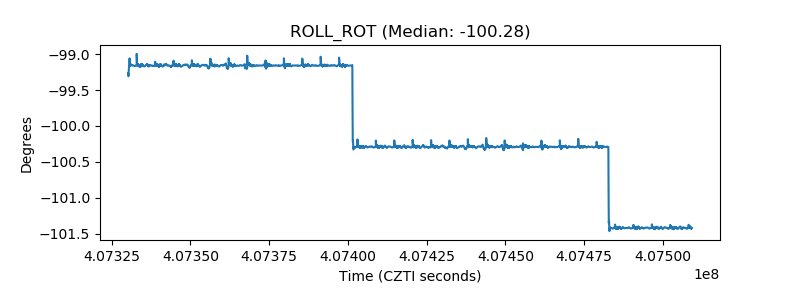 |
| _Roll_DEC | 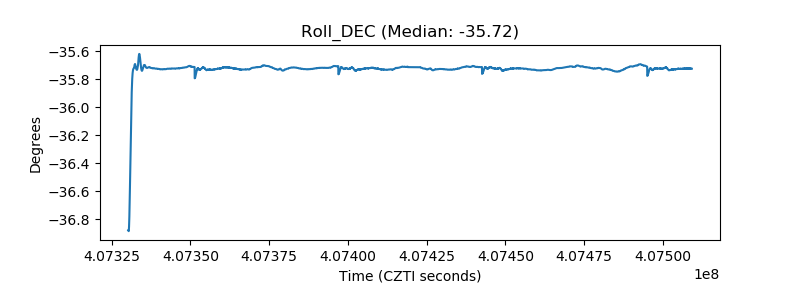 |
| _Roll_RA |  |
| Veto Counter | 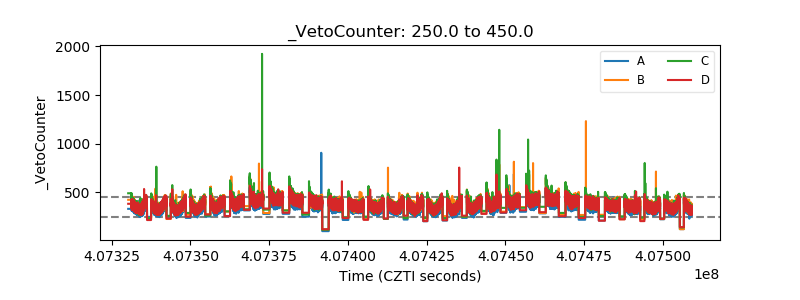 |