| Param | Original file | Final file |
|---|---|---|
| Filename | modeM0/AS1A12_044T04_9000005396cztM0_level2.fits | modeM0/AS1A12_044T04_9000005396cztM0_level2_quad_clean.evt |
| Size (bytes) | 419,304,960 | 368,648,640 |
| Size | 399.9 MB | 351.6 MB |
| Events in quadrant A | 2,531,400 | 2,155,001 |
| Events in quadrant B | 2,445,652 | 2,144,027 |
| Events in quadrant C | 2,509,996 | 2,081,721 |
| Events in quadrant D | 2,057,274 | 1,629,848 |
| Mode M0 | |||
|---|---|---|---|
| Quadrant | BADHDUFLAG | Total packets | Discarded packets |
| A | 0 | 100006 | 0 |
| B | 0 | 102939 | 0 |
| C | 0 | 98080 | 0 |
| D | 0 | 161070 | 0 |
| Mode SS | |||
|---|---|---|---|
| Quadrant | BADHDUFLAG | Total packets | Discarded packets |
| A | 0 | 938 | 0 |
| B | 0 | 938 | 0 |
| C | 0 | 938 | 0 |
| D | 0 | 938 | 0 |
| Mode M9 | |||
|---|---|---|---|
| Quadrant | BADHDUFLAG | Total packets | Discarded packets |
| A | 0 | 184 | 0 |
| B | 0 | 184 | 0 |
| C | 0 | 184 | 0 |
| D | 0 | 184 | 0 |
| Quadrant | Total seconds | Saturated seconds | Saturation percentage |
|---|---|---|---|
| A | 45932 | 151 | 0.328747% |
| B | 45932 | 744 | 1.619786% |
| C | 45932 | 234 | 0.509449% |
| D | 45932 | 4716 | 10.267352% |
Noise dominated data is calculated using 1-second bins in cleaned event files. If a bin has >2000 counts, and if more than 50% of those come from <1% of pixels, then it is considered to be noise-dominated and hence unusable.
| Quadrant | # 1 sec bins | Bins with >0 counts | Bins with >2000 counts | High rate bins dominated by noise | Noise dominated (total time) | Noise dominated (detector-on time) | Marked lightcurve |
|---|---|---|---|---|---|---|---|
| A | 64281 | 45932 | 0 | 0 | 0.00% | 0.00% |  |
| B | 64281 | 45931 | 0 | 0 | 0.00% | 0.00% | 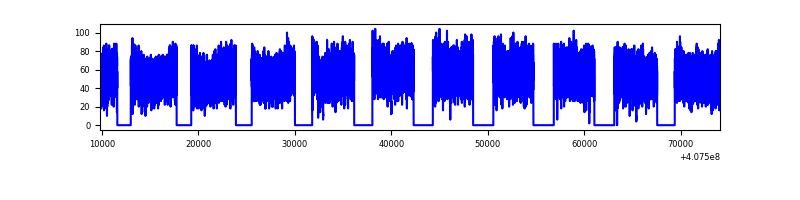 |
| C | 64281 | 45932 | 0 | 0 | 0.00% | 0.00% |  |
| D | 64281 | 45873 | 0 | 0 | 0.00% | 0.00% | 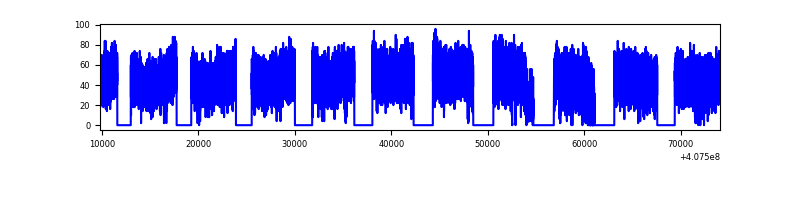 |
Top three noisy pixels from each quadrant. If the there are fewer than three noisy pixels in the level2.evt file, extra rows are filled as -1
| Pixel properties | Quadrant properties | ||||||
|---|---|---|---|---|---|---|---|
| Quadrant | DetID | PixID | Counts | Sigma | Mean | Median | Sigma |
| A | 0 | 29 | 2110 | 8.95 | 661 | 621 | 166.3 |
| A | 9 | 19 | 2041 | 8.54 | 661 | 621 | 166.3 |
| A | 7 | 110 | 2012 | 8.36 | 661 | 621 | 166.3 |
| B | 2 | 9 | 2105 | 11.7 | 647 | 618 | 127.1 |
| B | 3 | 80 | 1896 | 10.06 | 647 | 618 | 127.1 |
| B | 5 | 128 | 1722 | 8.69 | 647 | 618 | 127.1 |
| C | 1 | 81 | 1981 | 7.98 | 665 | 625 | 169.8 |
| C | 1 | 80 | 1854 | 7.24 | 665 | 625 | 169.8 |
| C | 3 | 187 | 1699 | 6.32 | 665 | 625 | 169.8 |
| D | 7 | 3 | 1540 | 6.36 | 587 | 535 | 157.9 |
| D | 4 | 160 | 1531 | 6.31 | 587 | 535 | 157.9 |
| D | 10 | 113 | 1523 | 6.26 | 587 | 535 | 157.9 |
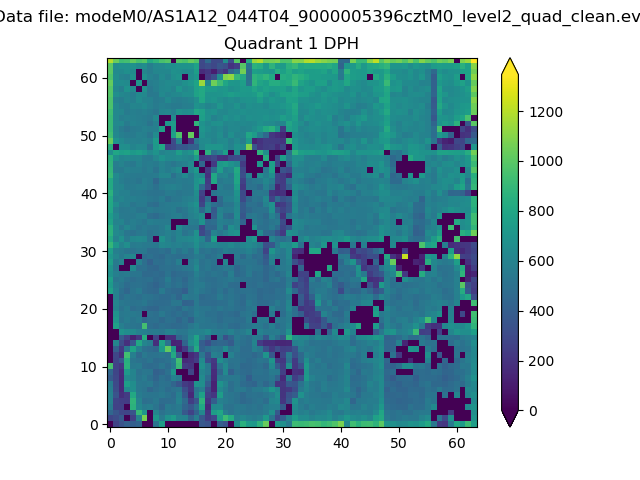
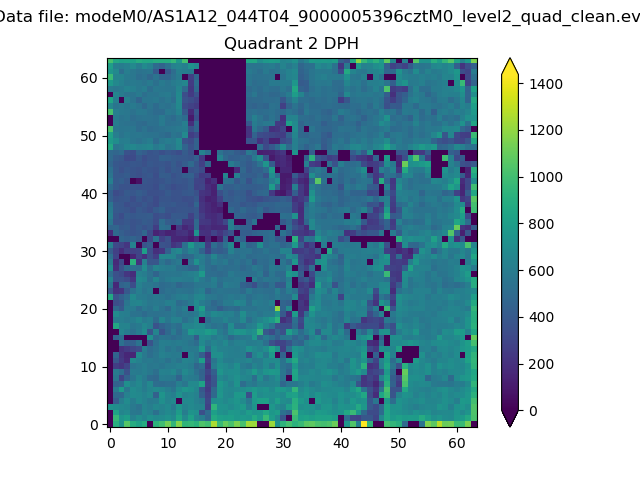
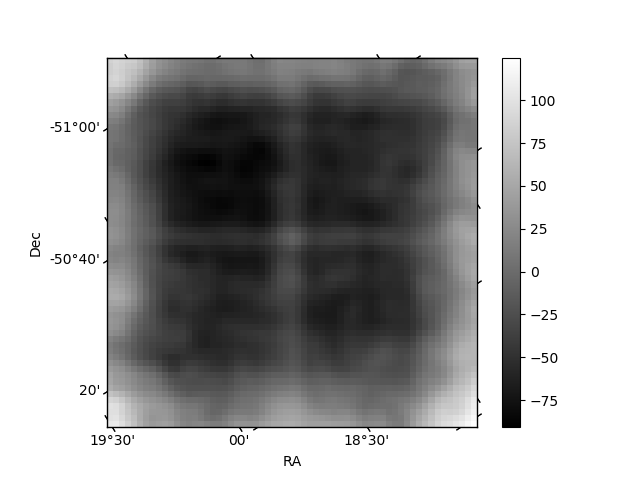
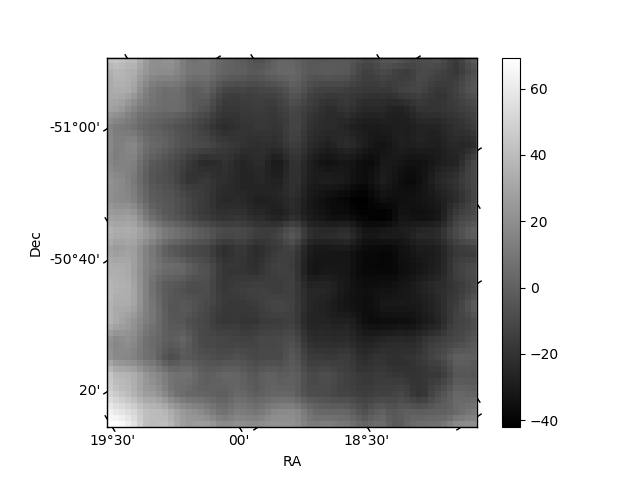
Histogram calculated using DETX and DETY for each event in the final _common_clean file
| Quadrant A |  |
 |
Quadrant B |
|---|---|---|---|
| Quadrant D | 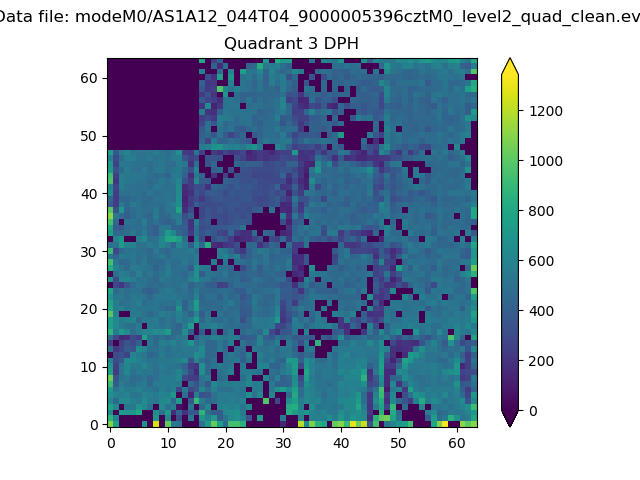 |
 |
Quadrant C |
| Plot type | Count rate plots | Images |
|---|---|---|
| Comparison with Poisson distribution Blue bars denote a histogram of data divided into 1 sec bins. Red curve is a Poisson curve with rate = median count rate of data. |
 |
 |
| Quadrant-wise count rates Data is divided into 100 sec bins |
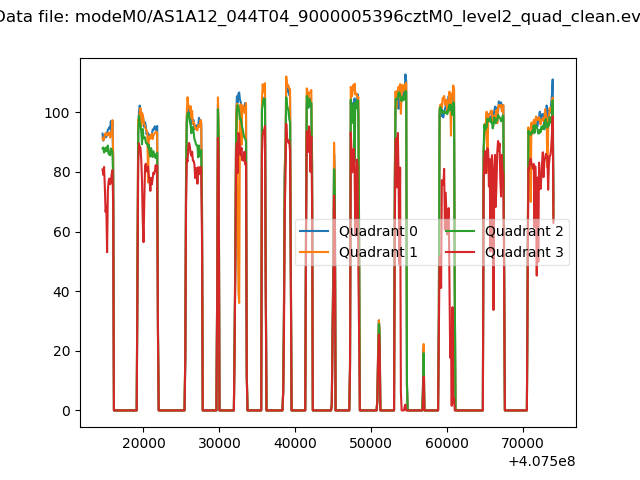 |
|
| Module-wise count rates for Quadrant A Data is divided into 100 sec bins |
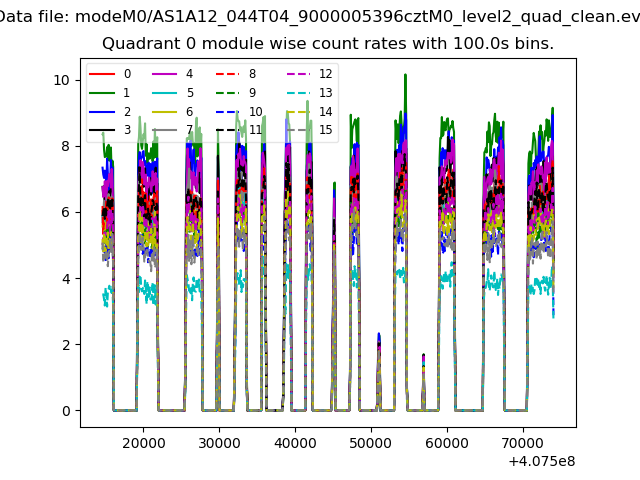 |
 |
| Module-wise count rates for Quadrant B Data is divided into 100 sec bins |
 |
 |
| Module-wise count rates for Quadrant C Data is divided into 100 sec bins |
 |
 |
| Module-wise count rates for Quadrant D Data is divided into 100 sec bins |
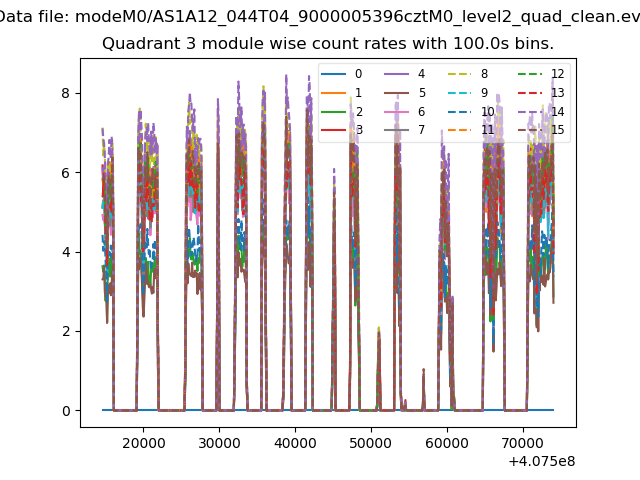 |
 |
| Parameter | Plot |
|---|---|
| CZT HV Monitor | 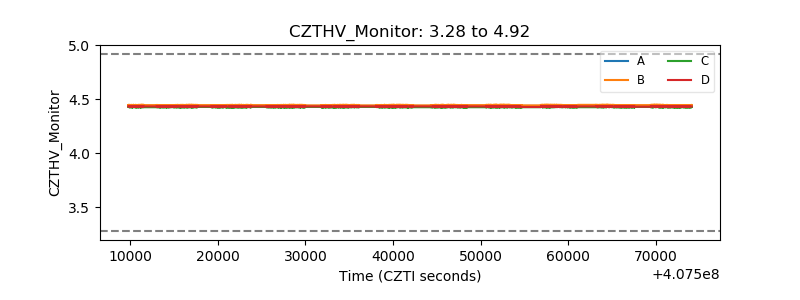 |
| D_VDD |  |
| Temperature 1 |  |
| Veto HV Monitor |  |
| Veto LLD |  |
| Alpha Counter | 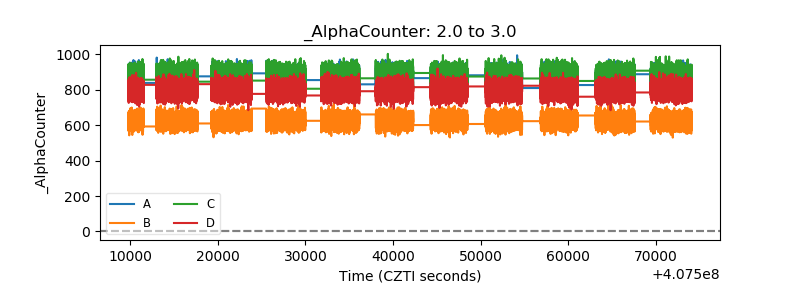 |
| _CPM_Rate |  |
| CZT Counter |  |
| +2.5 Volts monitor |  |
| +5 Volts monitor |  |
| _ROLL_ROT | 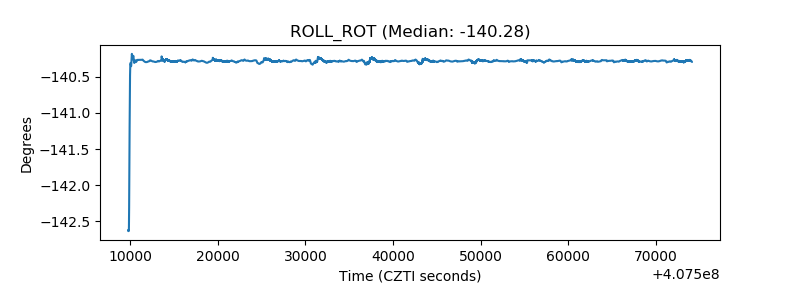 |
| _Roll_DEC |  |
| _Roll_RA |  |
| Veto Counter |  |