| Param | Original file | Final file |
|---|---|---|
| Filename | modeM0/AS1A12_025T11_9000005398cztM0_level2.fits | modeM0/AS1A12_025T11_9000005398cztM0_level2_quad_clean.evt |
| Size (bytes) | 196,560,000 | 160,917,120 |
| Size | 187.5 MB | 153.5 MB |
| Events in quadrant A | 1,171,698 | 881,237 |
| Events in quadrant B | 1,120,734 | 873,904 |
| Events in quadrant C | 1,160,676 | 841,068 |
| Events in quadrant D | 978,748 | 755,297 |
| Mode SS | |||
|---|---|---|---|
| Quadrant | BADHDUFLAG | Total packets | Discarded packets |
| A | 0 | 448 | 0 |
| B | 0 | 448 | 0 |
| C | 0 | 448 | 0 |
| D | 0 | 448 | 0 |
| Mode M0 | |||
|---|---|---|---|
| Quadrant | BADHDUFLAG | Total packets | Discarded packets |
| A | 0 | 51115 | 0 |
| B | 0 | 48951 | 0 |
| C | 0 | 46038 | 0 |
| D | 0 | 70137 | 0 |
| Mode M9 | |||
|---|---|---|---|
| Quadrant | BADHDUFLAG | Total packets | Discarded packets |
| A | 0 | 58 | 0 |
| B | 0 | 58 | 0 |
| C | 0 | 58 | 0 |
| D | 0 | 58 | 0 |
| Quadrant | Total seconds | Saturated seconds | Saturation percentage |
|---|---|---|---|
| A | 22099 | 118 | 0.533961% |
| B | 22099 | 437 | 1.977465% |
| C | 22099 | 62 | 0.280556% |
| D | 22099 | 1103 | 4.991176% |
Noise dominated data is calculated using 1-second bins in cleaned event files. If a bin has >2000 counts, and if more than 50% of those come from <1% of pixels, then it is considered to be noise-dominated and hence unusable.
| Quadrant | # 1 sec bins | Bins with >0 counts | Bins with >2000 counts | High rate bins dominated by noise | Noise dominated (total time) | Noise dominated (detector-on time) | Marked lightcurve |
|---|---|---|---|---|---|---|---|
| A | 27562 | 22098 | 0 | 0 | 0.00% | 0.00% |  |
| B | 27562 | 22094 | 0 | 0 | 0.00% | 0.00% |  |
| C | 27562 | 22098 | 0 | 0 | 0.00% | 0.00% |  |
| D | 27562 | 22090 | 0 | 0 | 0.00% | 0.00% |  |
Top three noisy pixels from each quadrant. If the there are fewer than three noisy pixels in the level2.evt file, extra rows are filled as -1
| Pixel properties | Quadrant properties | ||||||
|---|---|---|---|---|---|---|---|
| Quadrant | DetID | PixID | Counts | Sigma | Mean | Median | Sigma |
| A | 7 | 110 | 955 | 8.38 | 306 | 286 | 79.9 |
| A | 9 | 19 | 934 | 8.11 | 306 | 286 | 79.9 |
| A | 0 | 29 | 902 | 7.71 | 306 | 286 | 79.9 |
| B | 2 | 9 | 957 | 11.21 | 296 | 282 | 60.2 |
| B | 3 | 80 | 870 | 9.76 | 296 | 282 | 60.2 |
| B | 2 | 8 | 830 | 9.1 | 296 | 282 | 60.2 |
| C | 1 | 81 | 970 | 8.46 | 306 | 286 | 80.8 |
| C | 1 | 80 | 938 | 8.07 | 306 | 286 | 80.8 |
| C | 3 | 202 | 883 | 7.39 | 306 | 286 | 80.8 |
| D | 7 | 3 | 722 | 6.11 | 279 | 254 | 76.6 |
| D | 10 | 113 | 707 | 5.92 | 279 | 254 | 76.6 |
| D | 6 | 62 | 707 | 5.92 | 279 | 254 | 76.6 |
Histogram calculated using DETX and DETY for each event in the final _common_clean file
| Quadrant A |  |
 |
Quadrant B |
|---|---|---|---|
| Quadrant D | 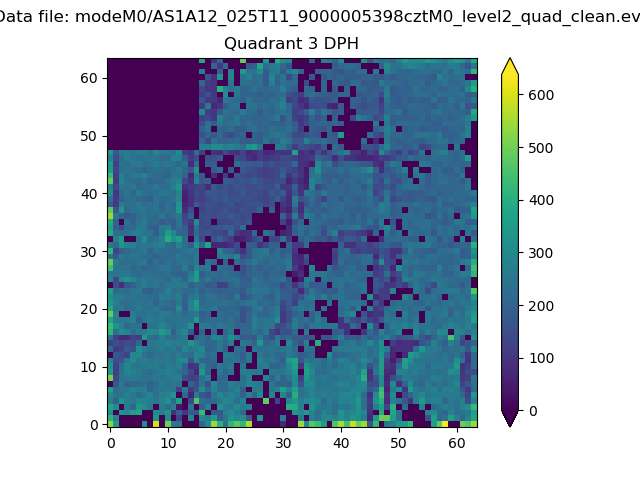 |
 |
Quadrant C |
| Plot type | Count rate plots | Images |
|---|---|---|
| Comparison with Poisson distribution Blue bars denote a histogram of data divided into 1 sec bins. Red curve is a Poisson curve with rate = median count rate of data. |
 |
 |
| Quadrant-wise count rates Data is divided into 100 sec bins |
 |
|
| Module-wise count rates for Quadrant A Data is divided into 100 sec bins |
 |
 |
| Module-wise count rates for Quadrant B Data is divided into 100 sec bins |
 |
 |
| Module-wise count rates for Quadrant C Data is divided into 100 sec bins |
 |
 |
| Module-wise count rates for Quadrant D Data is divided into 100 sec bins |
 |
 |
| Parameter | Plot |
|---|---|
| CZT HV Monitor |  |
| D_VDD |  |
| Temperature 1 |  |
| Veto HV Monitor |  |
| Veto LLD |  |
| Alpha Counter |  |
| _CPM_Rate |  |
| CZT Counter |  |
| +2.5 Volts monitor |  |
| +5 Volts monitor |  |
| _ROLL_ROT |  |
| _Roll_DEC |  |
| _Roll_RA |  |
| Veto Counter |  |