| Param | Original file | Final file |
|---|---|---|
| Filename | modeM0/AS1A12_025T17_9000005400cztM0_level2.fits | modeM0/AS1A12_025T17_9000005400cztM0_level2_quad_clean.evt |
| Size (bytes) | 98,375,040 | 67,832,640 |
| Size | 93.8 MB | 64.7 MB |
| Events in quadrant A | 589,878 | 355,156 |
| Events in quadrant B | 568,936 | 334,083 |
| Events in quadrant C | 587,182 | 339,067 |
| Events in quadrant D | 489,526 | 281,152 |
| Mode M9 | |||
|---|---|---|---|
| Quadrant | BADHDUFLAG | Total packets | Discarded packets |
| A | 0 | 52 | 0 |
| B | 0 | 52 | 0 |
| C | 0 | 52 | 0 |
| D | 0 | 52 | 0 |
| Mode SS | |||
|---|---|---|---|
| Quadrant | BADHDUFLAG | Total packets | Discarded packets |
| A | 0 | 220 | 0 |
| B | 0 | 220 | 0 |
| C | 0 | 220 | 0 |
| D | 0 | 220 | 0 |
| Mode M0 | |||
|---|---|---|---|
| Quadrant | BADHDUFLAG | Total packets | Discarded packets |
| A | 0 | 28123 | 0 |
| B | 0 | 27151 | 0 |
| C | 0 | 22329 | 0 |
| D | 0 | 39500 | 0 |
| Quadrant | Total seconds | Saturated seconds | Saturation percentage |
|---|---|---|---|
| A | 10738 | 209 | 1.946359% |
| B | 10738 | 530 | 4.935742% |
| C | 10738 | 28 | 0.260756% |
| D | 10738 | 738 | 6.872788% |
Noise dominated data is calculated using 1-second bins in cleaned event files. If a bin has >2000 counts, and if more than 50% of those come from <1% of pixels, then it is considered to be noise-dominated and hence unusable.
| Quadrant | # 1 sec bins | Bins with >0 counts | Bins with >2000 counts | High rate bins dominated by noise | Noise dominated (total time) | Noise dominated (detector-on time) | Marked lightcurve |
|---|---|---|---|---|---|---|---|
| A | 15906 | 10738 | 0 | 0 | 0.00% | 0.00% |  |
| B | 15906 | 10736 | 0 | 0 | 0.00% | 0.00% | 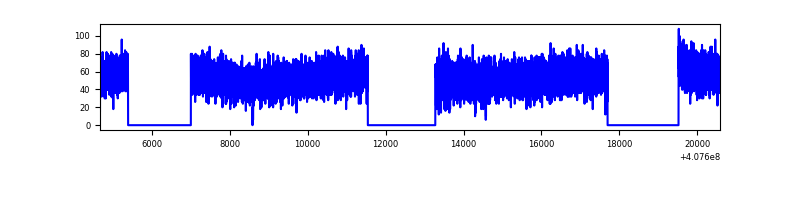 |
| C | 15906 | 10738 | 0 | 0 | 0.00% | 0.00% |  |
| D | 15906 | 10726 | 0 | 0 | 0.00% | 0.00% |  |
Top three noisy pixels from each quadrant. If the there are fewer than three noisy pixels in the level2.evt file, extra rows are filled as -1
| Pixel properties | Quadrant properties | ||||||
|---|---|---|---|---|---|---|---|
| Quadrant | DetID | PixID | Counts | Sigma | Mean | Median | Sigma |
| A | 7 | 110 | 506 | 8.97 | 153 | 144 | 40.4 |
| A | 0 | 29 | 482 | 8.37 | 153 | 144 | 40.4 |
| A | 15 | 236 | 461 | 7.85 | 153 | 144 | 40.4 |
| B | 2 | 9 | 492 | 10.8 | 150 | 143 | 32.3 |
| B | 3 | 80 | 418 | 8.51 | 150 | 143 | 32.3 |
| B | 2 | 8 | 400 | 7.96 | 150 | 143 | 32.3 |
| C | 3 | 203 | 476 | 7.79 | 155 | 145 | 42.5 |
| C | 1 | 81 | 458 | 7.37 | 155 | 145 | 42.5 |
| C | 3 | 202 | 452 | 7.23 | 155 | 145 | 42.5 |
| D | 7 | 3 | 394 | 6.93 | 139 | 127 | 38.5 |
| D | 12 | 6 | 374 | 6.41 | 139 | 127 | 38.5 |
| D | 4 | 160 | 362 | 6.1 | 139 | 127 | 38.5 |
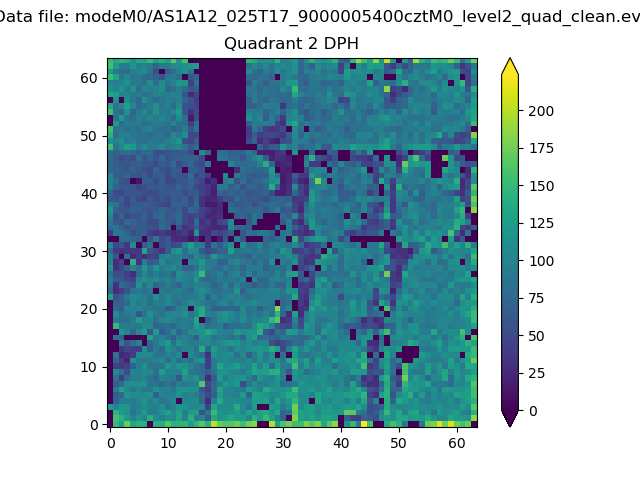
Histogram calculated using DETX and DETY for each event in the final _common_clean file
| Quadrant A |  |
 |
Quadrant B |
|---|---|---|---|
| Quadrant D | 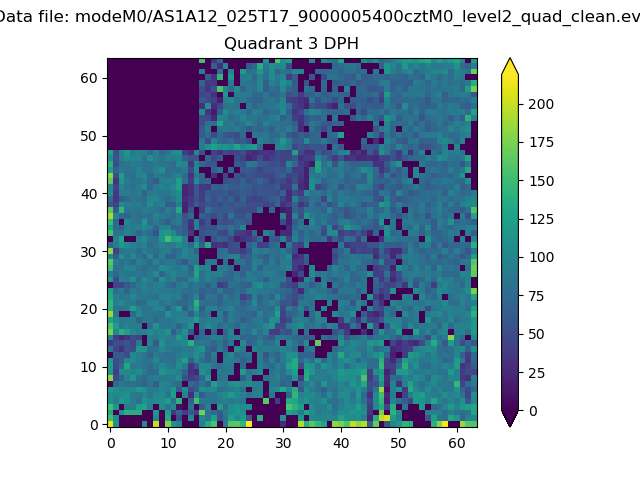 |
 |
Quadrant C |
| Plot type | Count rate plots | Images |
|---|---|---|
| Comparison with Poisson distribution Blue bars denote a histogram of data divided into 1 sec bins. Red curve is a Poisson curve with rate = median count rate of data. |
 |
 |
| Quadrant-wise count rates Data is divided into 100 sec bins |
 |
|
| Module-wise count rates for Quadrant A Data is divided into 100 sec bins |
 |
 |
| Module-wise count rates for Quadrant B Data is divided into 100 sec bins |
 |
 |
| Module-wise count rates for Quadrant C Data is divided into 100 sec bins |
 |
 |
| Module-wise count rates for Quadrant D Data is divided into 100 sec bins |
 |
 |
| Parameter | Plot |
|---|---|
| CZT HV Monitor |  |
| D_VDD |  |
| Temperature 1 |  |
| Veto HV Monitor | 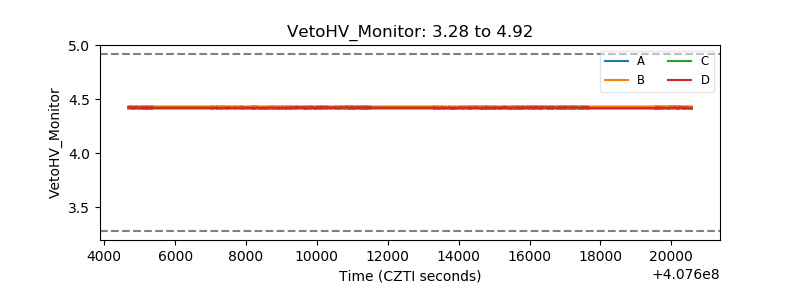 |
| Veto LLD | 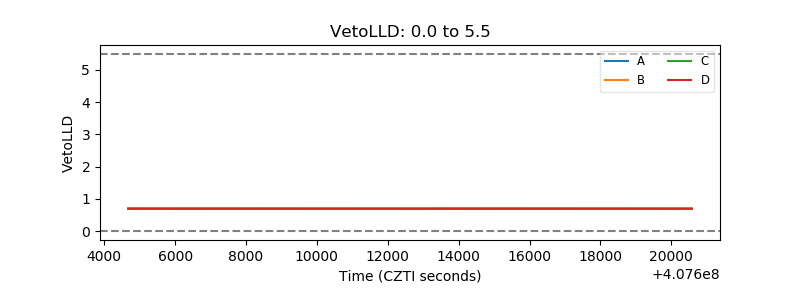 |
| Alpha Counter |  |
| _CPM_Rate |  |
| CZT Counter |  |
| +2.5 Volts monitor |  |
| +5 Volts monitor |  |
| _ROLL_ROT |  |
| _Roll_DEC |  |
| _Roll_RA |  |
| Veto Counter |  |