| Param | Original file | Final file |
|---|---|---|
| Filename | modeM0/AS1A12_083T02_9000005404cztM0_level2.fits | modeM0/AS1A12_083T02_9000005404cztM0_level2_quad_clean.evt |
| Size (bytes) | 283,878,720 | 269,591,040 |
| Size | 270.7 MB | 257.1 MB |
| Events in quadrant A | 1,711,734 | 1,583,478 |
| Events in quadrant B | 1,660,316 | 1,611,046 |
| Events in quadrant C | 1,689,228 | 1,537,996 |
| Events in quadrant D | 1,374,026 | 1,270,370 |
| Mode M0 | |||
|---|---|---|---|
| Quadrant | BADHDUFLAG | Total packets | Discarded packets |
| A | 0 | 70147 | 0 |
| B | 0 | 66219 | 0 |
| C | 0 | 65580 | 0 |
| D | 0 | 104455 | 0 |
| Mode SS | |||
|---|---|---|---|
| Quadrant | BADHDUFLAG | Total packets | Discarded packets |
| A | 0 | 640 | 0 |
| B | 0 | 640 | 0 |
| C | 0 | 640 | 0 |
| D | 0 | 640 | 0 |
| Mode M9 | |||
|---|---|---|---|
| Quadrant | BADHDUFLAG | Total packets | Discarded packets |
| A | 0 | 131 | 0 |
| B | 0 | 131 | 0 |
| C | 0 | 131 | 0 |
| D | 0 | 131 | 0 |
| Quadrant | Total seconds | Saturated seconds | Saturation percentage |
|---|---|---|---|
| A | 31453 | 205 | 0.651766% |
| B | 31453 | 203 | 0.645407% |
| C | 31453 | 137 | 0.435571% |
| D | 31453 | 3295 | 10.475948% |
Noise dominated data is calculated using 1-second bins in cleaned event files. If a bin has >2000 counts, and if more than 50% of those come from <1% of pixels, then it is considered to be noise-dominated and hence unusable.
| Quadrant | # 1 sec bins | Bins with >0 counts | Bins with >2000 counts | High rate bins dominated by noise | Noise dominated (total time) | Noise dominated (detector-on time) | Marked lightcurve |
|---|---|---|---|---|---|---|---|
| A | 44451 | 31453 | 0 | 0 | 0.00% | 0.00% | 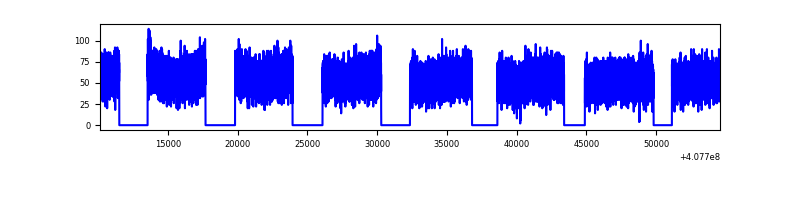 |
| B | 44451 | 31451 | 0 | 0 | 0.00% | 0.00% | 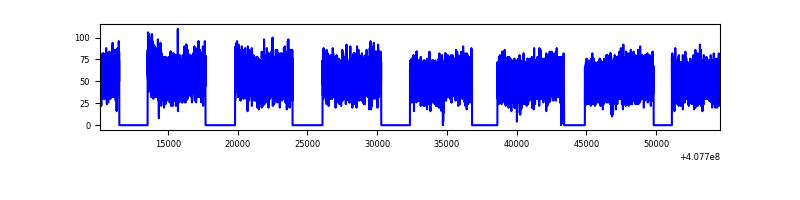 |
| C | 44451 | 31453 | 0 | 0 | 0.00% | 0.00% | 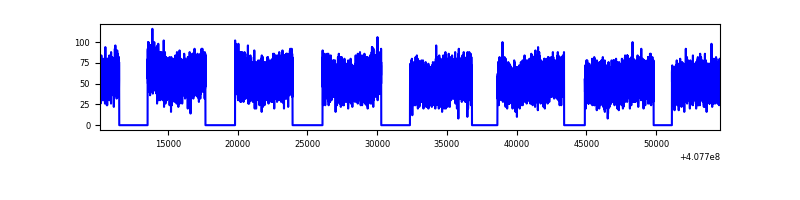 |
| D | 44451 | 31434 | 0 | 0 | 0.00% | 0.00% | 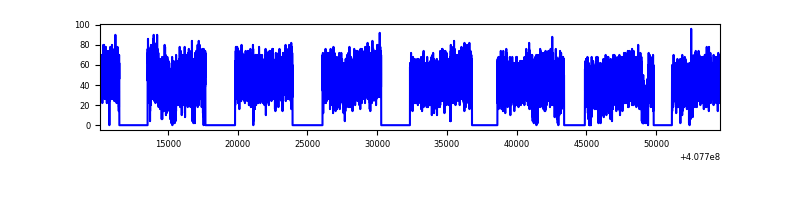 |
Top three noisy pixels from each quadrant. If the there are fewer than three noisy pixels in the level2.evt file, extra rows are filled as -1
| Pixel properties | Quadrant properties | ||||||
|---|---|---|---|---|---|---|---|
| Quadrant | DetID | PixID | Counts | Sigma | Mean | Median | Sigma |
| A | 7 | 110 | 1457 | 9.05 | 447 | 421 | 114.4 |
| A | 9 | 19 | 1399 | 8.55 | 447 | 421 | 114.4 |
| A | 0 | 29 | 1374 | 8.33 | 447 | 421 | 114.4 |
| B | 2 | 9 | 1429 | 11.69 | 439 | 420 | 86.3 |
| B | 3 | 80 | 1332 | 10.57 | 439 | 420 | 86.3 |
| B | 5 | 128 | 1170 | 8.69 | 439 | 420 | 86.3 |
| C | 1 | 81 | 1413 | 8.6 | 446 | 420 | 115.5 |
| C | 3 | 203 | 1374 | 8.26 | 446 | 420 | 115.5 |
| C | 1 | 80 | 1358 | 8.12 | 446 | 420 | 115.5 |
| D | 10 | 189 | 1047 | 6.55 | 392 | 358 | 105.3 |
| D | 10 | 113 | 1042 | 6.5 | 392 | 358 | 105.3 |
| D | 1 | 3 | 1032 | 6.4 | 392 | 358 | 105.3 |
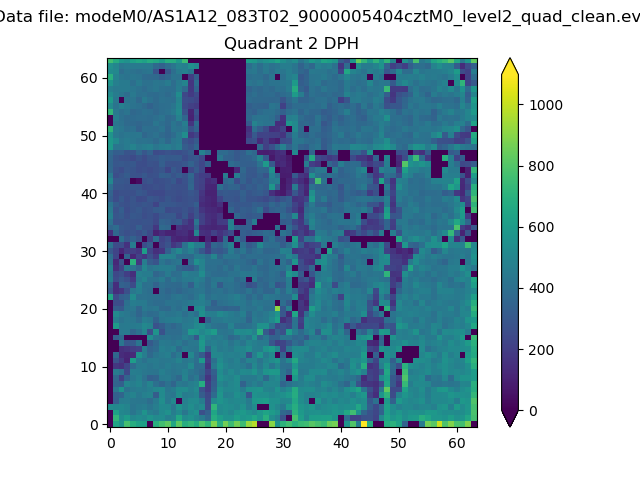
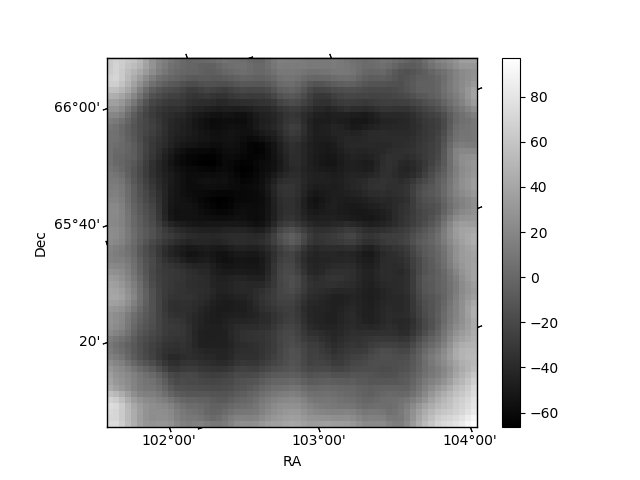
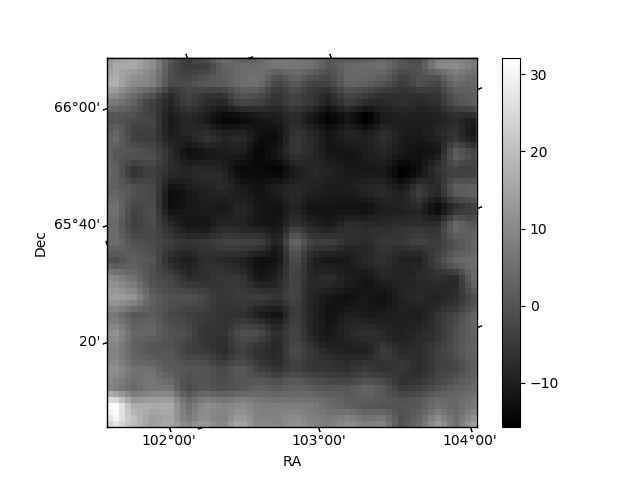
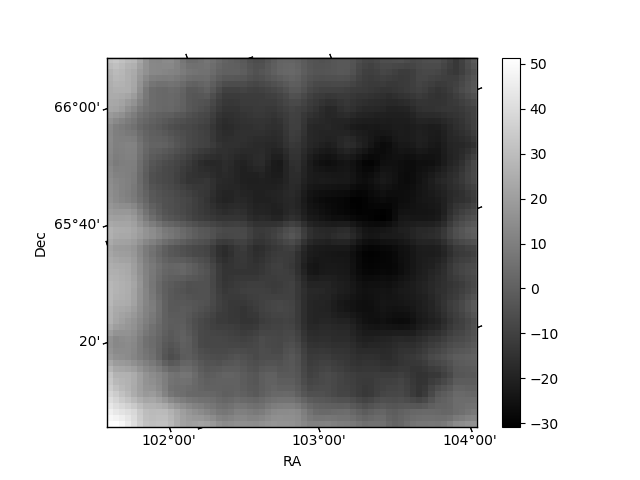
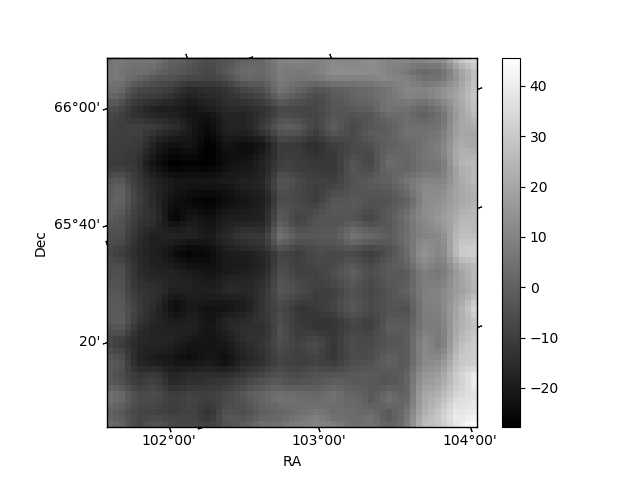
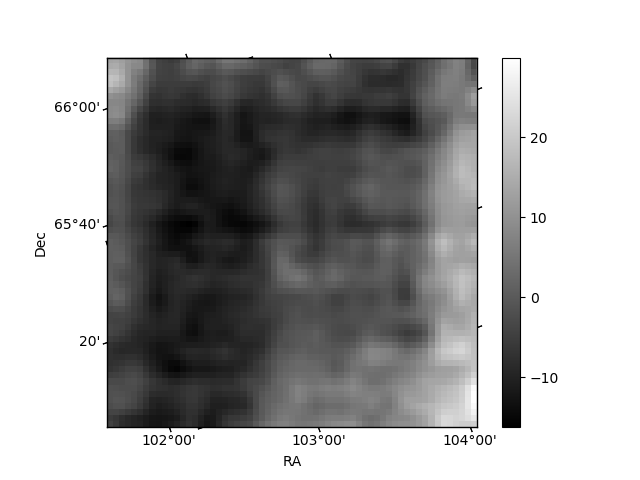
Histogram calculated using DETX and DETY for each event in the final _common_clean file
| Quadrant A | 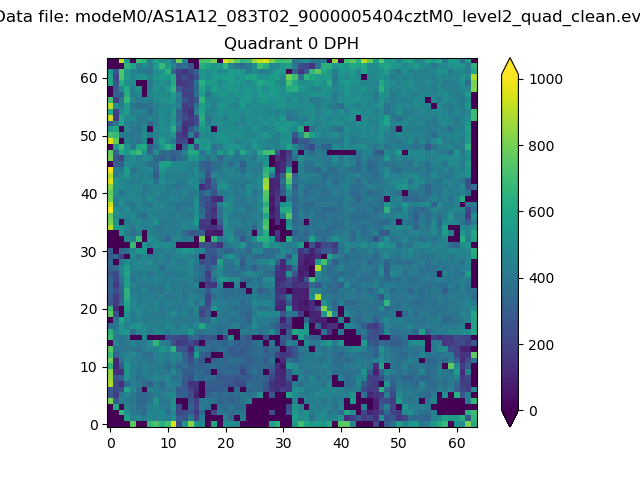 |
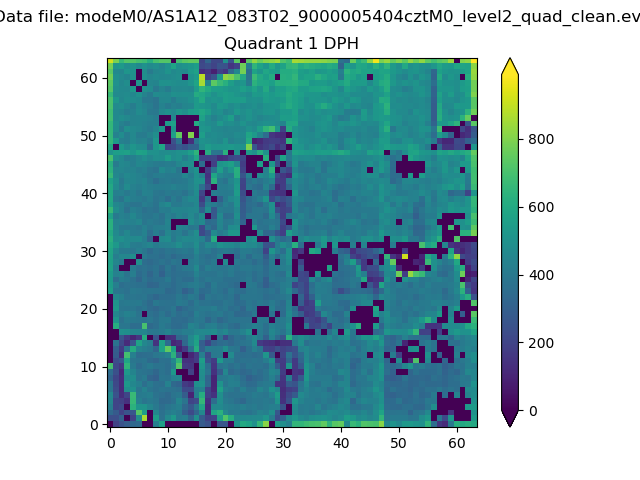 |
Quadrant B |
|---|---|---|---|
| Quadrant D | 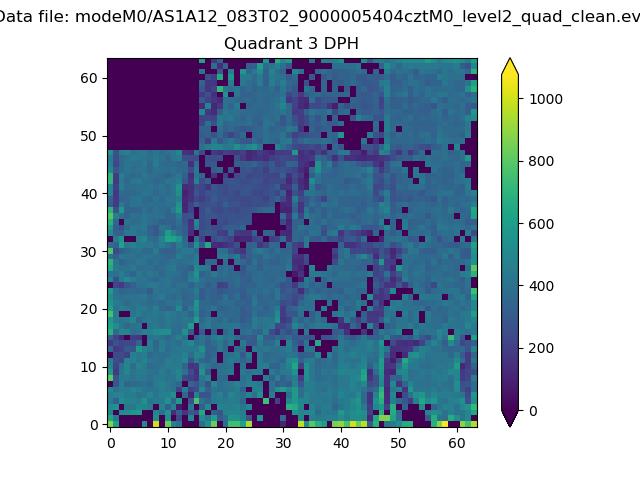 |
 |
Quadrant C |
| Plot type | Count rate plots | Images |
|---|---|---|
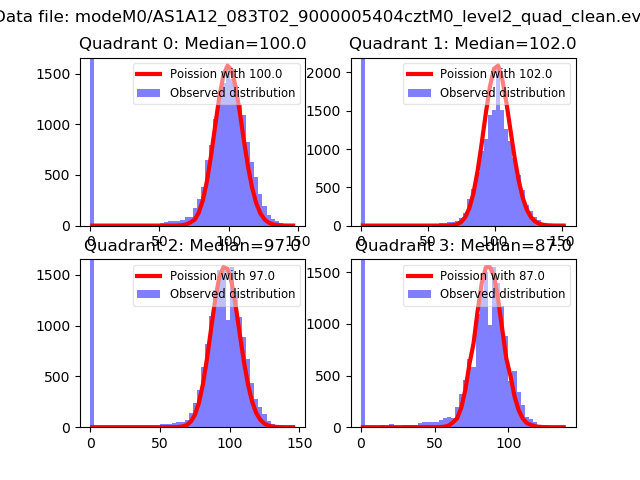
| Comparison with Poisson distribution Blue bars denote a histogram of data divided into 1 sec bins. Red curve is a Poisson curve with rate = median count rate of data. |
 |
 |
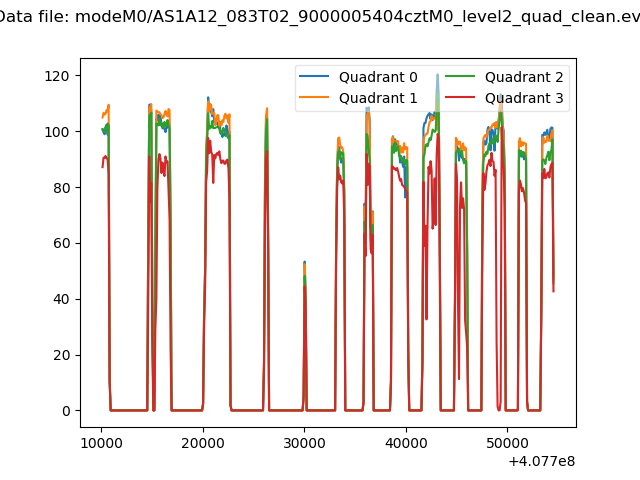
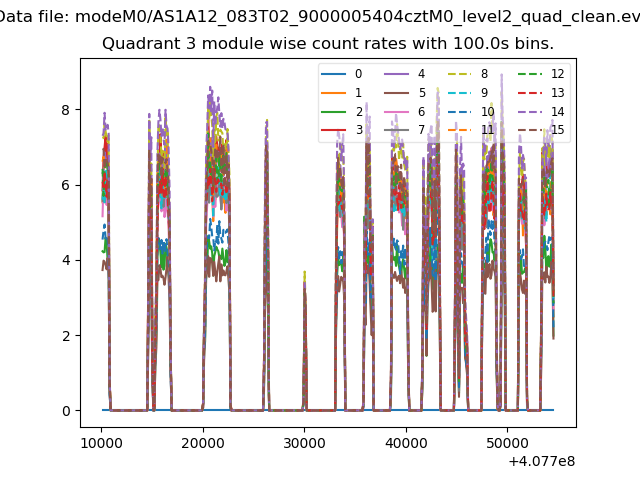
| Quadrant-wise count rates Data is divided into 100 sec bins |
 |
|
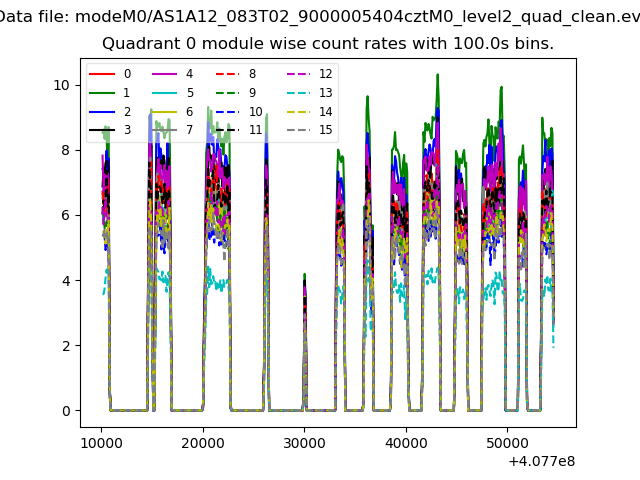
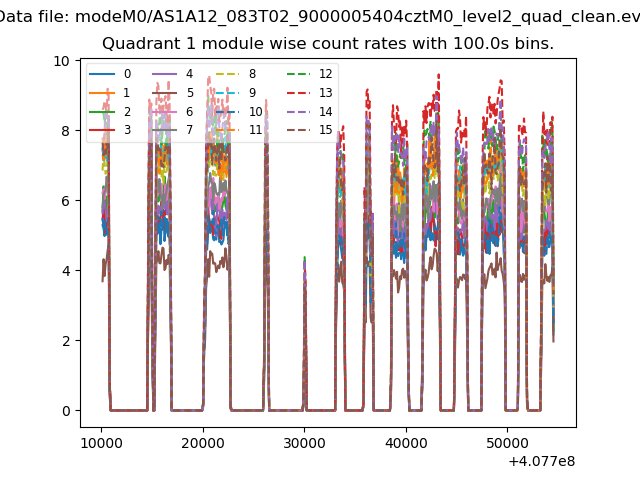
| Module-wise count rates for Quadrant A Data is divided into 100 sec bins |
 |
 |
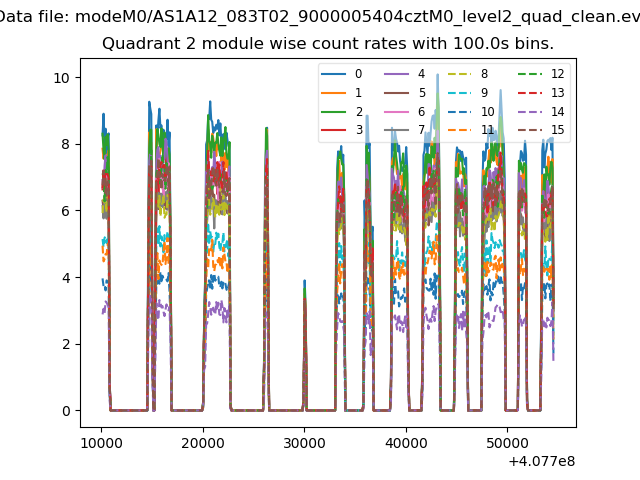
| Module-wise count rates for Quadrant B Data is divided into 100 sec bins |
 |
 |
| Module-wise count rates for Quadrant C Data is divided into 100 sec bins |
 |
 |
| Module-wise count rates for Quadrant D Data is divided into 100 sec bins |
 |
 |
| Parameter | Plot |
|---|---|
| CZT HV Monitor | 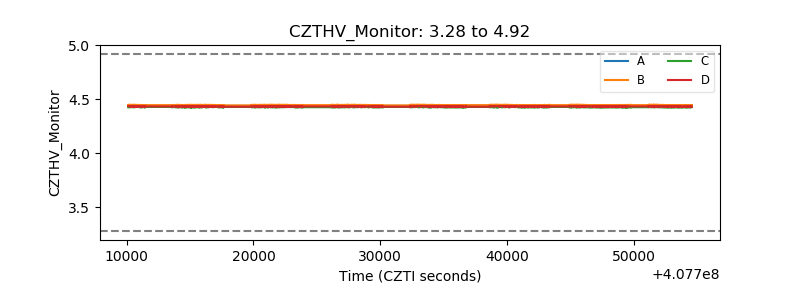 |
| D_VDD | 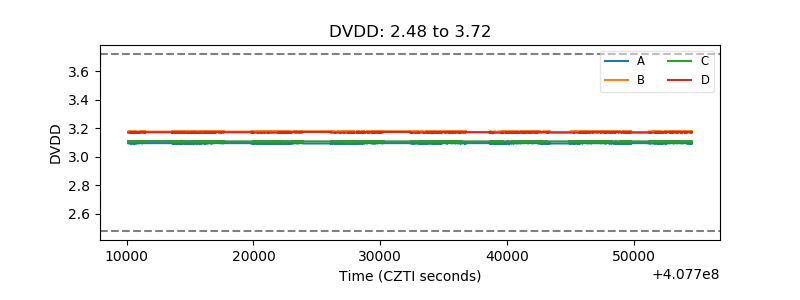 |
| Temperature 1 | 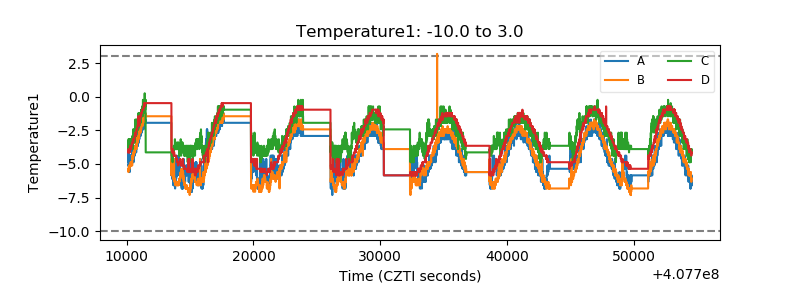 |
| Veto HV Monitor | 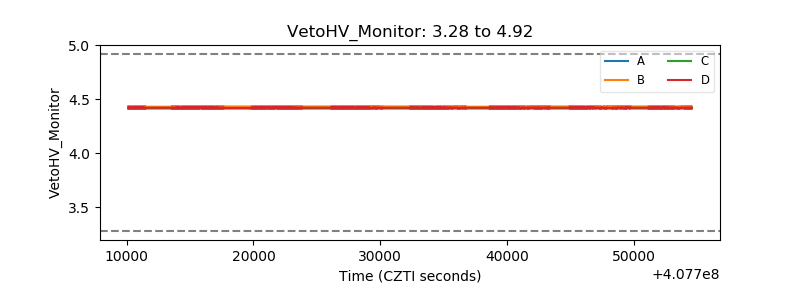 |
| Veto LLD | 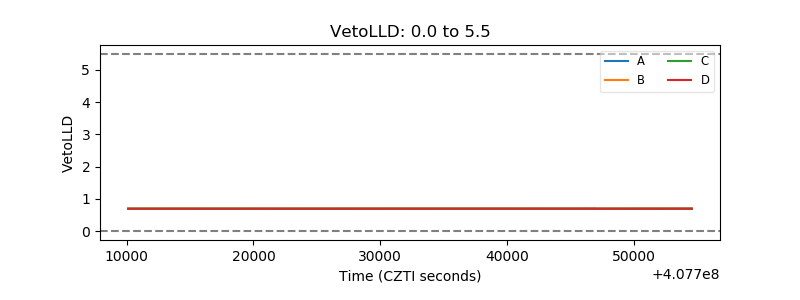 |
| Alpha Counter | 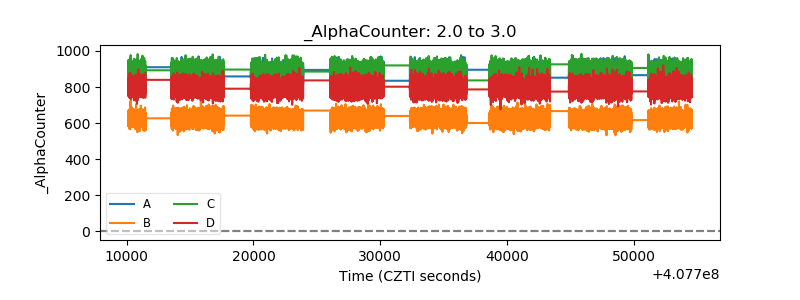 |
| _CPM_Rate | 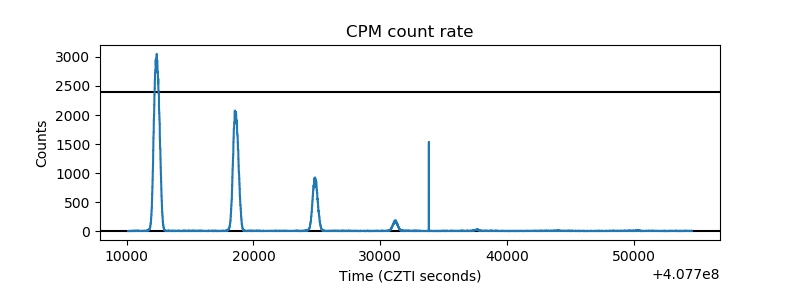 |
| CZT Counter | 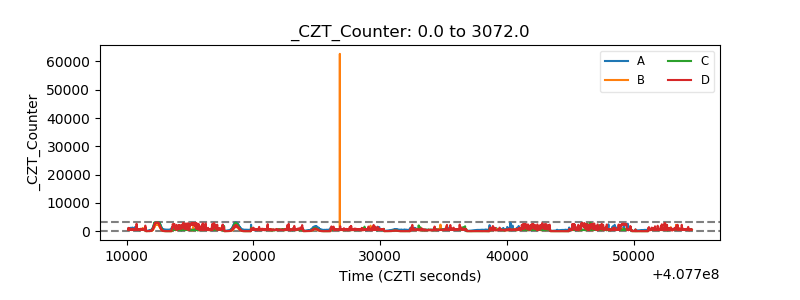 |
| +2.5 Volts monitor | 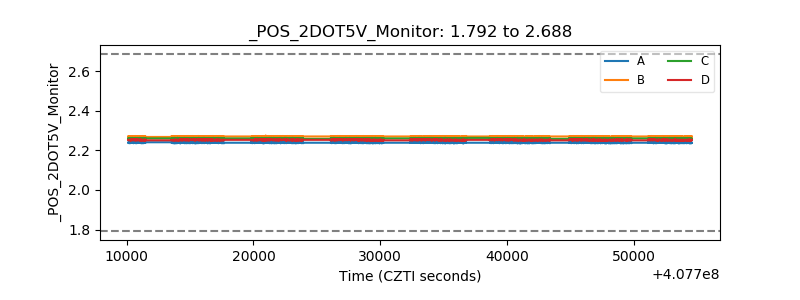 |
| +5 Volts monitor | 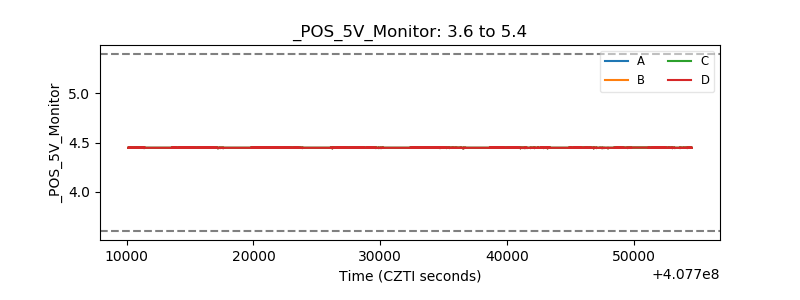 |
| _ROLL_ROT | 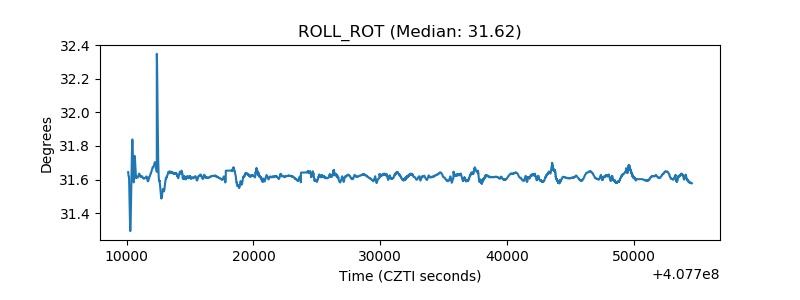 |
| _Roll_DEC | 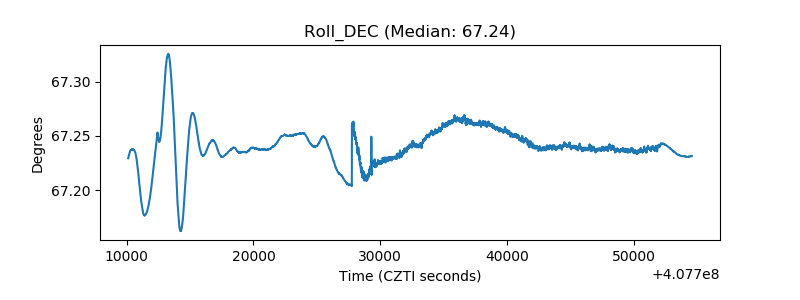 |
| _Roll_RA | 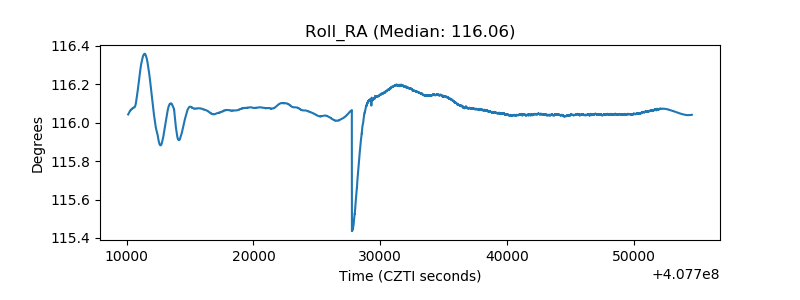 |
| Veto Counter | 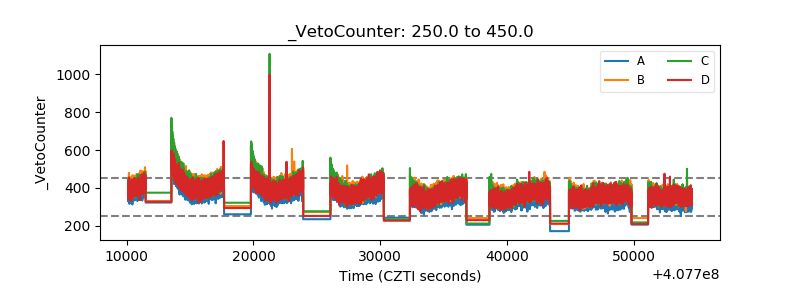 |