| Param | Original file | Final file |
|---|---|---|
| Filename | modeM0/AS1A12_077T06_9000005408cztM0_level2.fits | modeM0/AS1A12_077T06_9000005408cztM0_level2_quad_clean.evt |
| Size (bytes) | 1,591,096,320 | 1,753,505,280 |
| Size | 1.5 GB | 1.6 GB |
| Events in quadrant A | 9,642,922 | 10,821,154 |
| Events in quadrant B | 9,271,630 | 10,867,158 |
| Events in quadrant C | 9,593,284 | 10,532,640 |
| Events in quadrant D | 7,791,290 | 9,007,504 |
| Mode M9 | |||
|---|---|---|---|
| Quadrant | BADHDUFLAG | Total packets | Discarded packets |
| A | 0 | 658 | 0 |
| B | 0 | 658 | 0 |
| C | 0 | 658 | 0 |
| D | 0 | 658 | 0 |
| Mode SS | |||
|---|---|---|---|
| Quadrant | BADHDUFLAG | Total packets | Discarded packets |
| A | 0 | 3550 | 0 |
| B | 0 | 3550 | 0 |
| C | 0 | 3550 | 0 |
| D | 0 | 3550 | 0 |
| Mode M0 | |||
|---|---|---|---|
| Quadrant | BADHDUFLAG | Total packets | Discarded packets |
| A | 0 | 379648 | 0 |
| B | 0 | 391611 | 0 |
| C | 0 | 358285 | 0 |
| D | 0 | 551322 | 0 |
| Quadrant | Total seconds | Saturated seconds | Saturation percentage |
|---|---|---|---|
| A | 173411 | 976 | 0.562825% |
| B | 173410 | 3056 | 1.762297% |
| C | 173411 | 353 | 0.203563% |
| D | 173411 | 16033 | 9.245665% |
Noise dominated data is calculated using 1-second bins in cleaned event files. If a bin has >2000 counts, and if more than 50% of those come from <1% of pixels, then it is considered to be noise-dominated and hence unusable.
| Quadrant | # 1 sec bins | Bins with >0 counts | Bins with >2000 counts | High rate bins dominated by noise | Noise dominated (total time) | Noise dominated (detector-on time) | Marked lightcurve |
|---|---|---|---|---|---|---|---|
| A | 239520 | 173412 | 0 | 0 | 0.00% | 0.00% |  |
| B | 239520 | 173388 | 0 | 0 | 0.00% | 0.00% |  |
| C | 239520 | 173406 | 0 | 0 | 0.00% | 0.00% |  |
| D | 239520 | 172761 | 0 | 0 | 0.00% | 0.00% |  |
Top three noisy pixels from each quadrant. If the there are fewer than three noisy pixels in the level2.evt file, extra rows are filled as -1
| Pixel properties | Quadrant properties | ||||||
|---|---|---|---|---|---|---|---|
| Quadrant | DetID | PixID | Counts | Sigma | Mean | Median | Sigma |
| A | 7 | 110 | 7850 | 8.75 | 2516 | 2358 | 627.7 |
| A | 9 | 19 | 7844 | 8.74 | 2516 | 2358 | 627.7 |
| A | 0 | 29 | 7713 | 8.53 | 2516 | 2358 | 627.7 |
| B | 2 | 9 | 8115 | 12.1 | 2452 | 2335 | 477.5 |
| B | 3 | 80 | 7205 | 10.2 | 2452 | 2335 | 477.5 |
| B | 5 | 255 | 6617 | 8.97 | 2452 | 2335 | 477.5 |
| C | 1 | 81 | 7943 | 8.62 | 2539 | 2385 | 644.4 |
| C | 1 | 80 | 7626 | 8.13 | 2539 | 2385 | 644.4 |
| C | 3 | 203 | 7621 | 8.12 | 2539 | 2385 | 644.4 |
| D | 10 | 189 | 5878 | 6.52 | 2232 | 2036 | 589.4 |
| D | 7 | 3 | 5764 | 6.33 | 2232 | 2036 | 589.4 |
| D | 4 | 160 | 5707 | 6.23 | 2232 | 2036 | 589.4 |
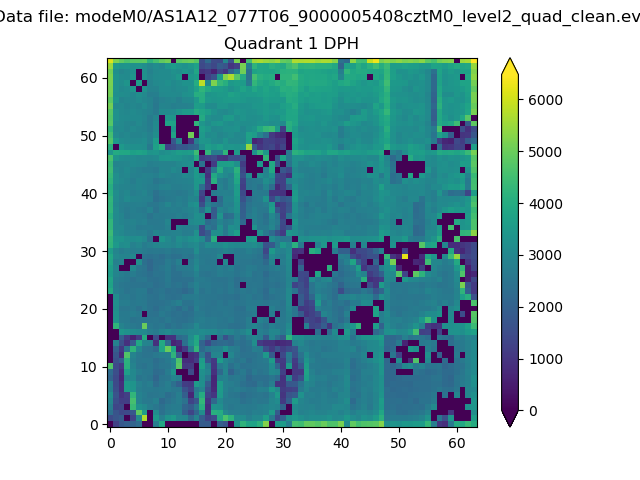
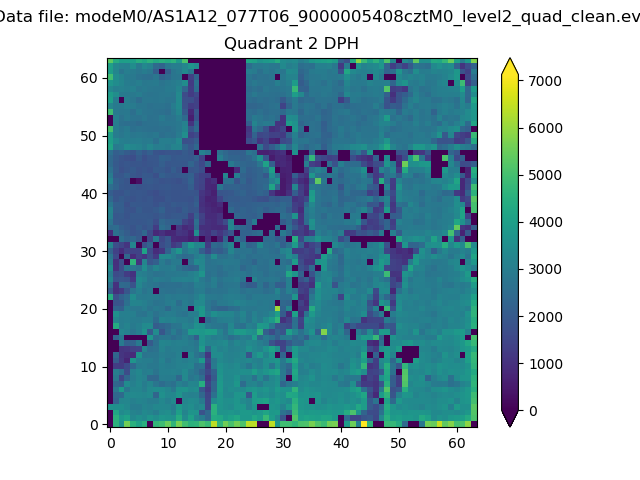
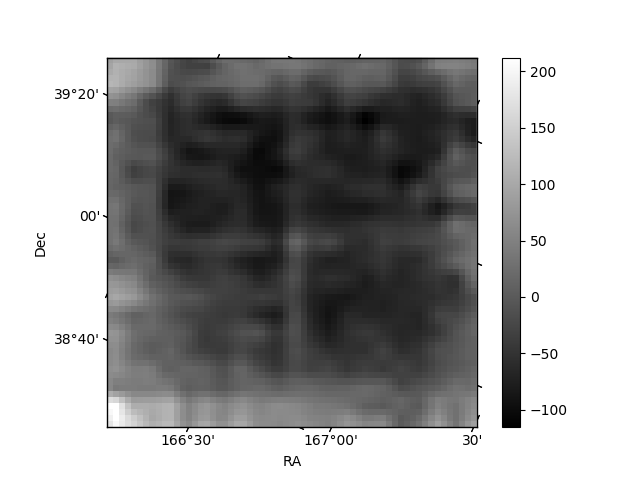
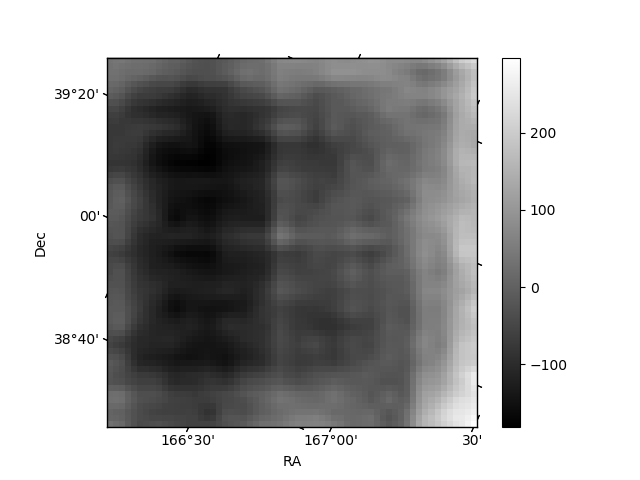
Histogram calculated using DETX and DETY for each event in the final _common_clean file
| Quadrant A |  |
 |
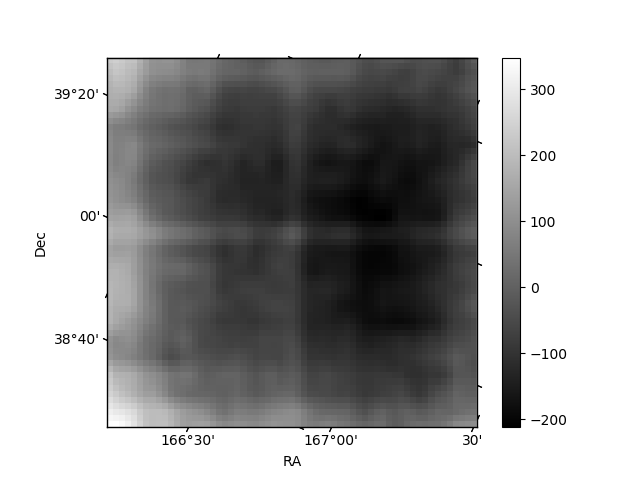
Quadrant B |
|---|---|---|---|
| Quadrant D | 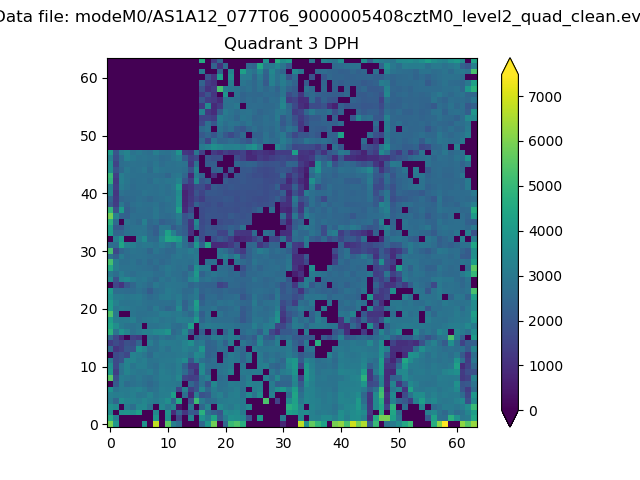 |
 |
Quadrant C |
| Plot type | Count rate plots | Images |
|---|---|---|
| Comparison with Poisson distribution Blue bars denote a histogram of data divided into 1 sec bins. Red curve is a Poisson curve with rate = median count rate of data. |
 |
 |
| Quadrant-wise count rates Data is divided into 100 sec bins |
 |
|
| Module-wise count rates for Quadrant A Data is divided into 100 sec bins |
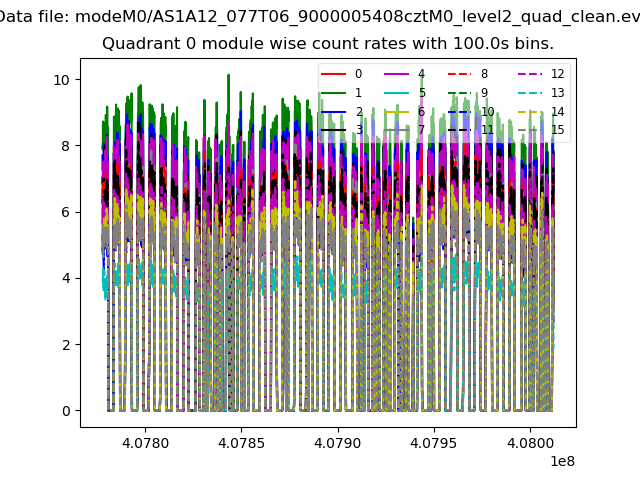 |
 |
| Module-wise count rates for Quadrant B Data is divided into 100 sec bins |
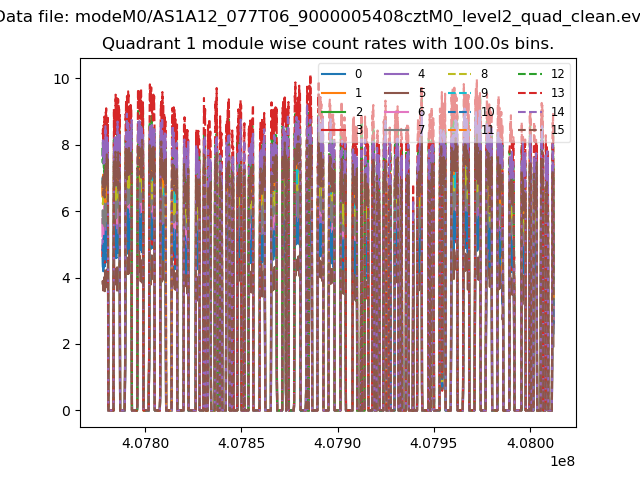 |
 |
| Module-wise count rates for Quadrant C Data is divided into 100 sec bins |
 |
 |
| Module-wise count rates for Quadrant D Data is divided into 100 sec bins |
 |
 |
| Parameter | Plot |
|---|---|
| CZT HV Monitor | 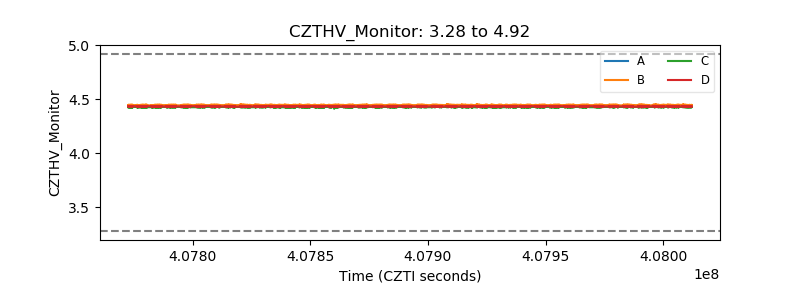 |
| D_VDD |  |
| Temperature 1 | 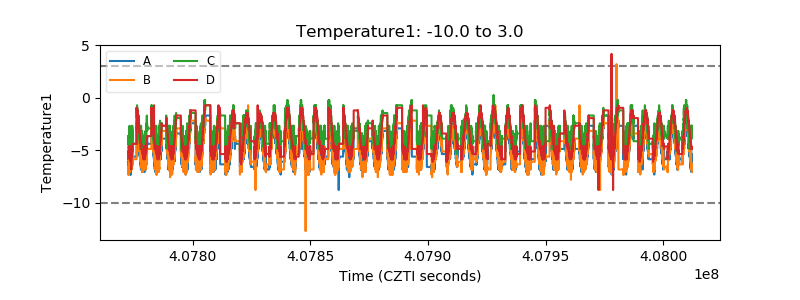 |
| Veto HV Monitor | 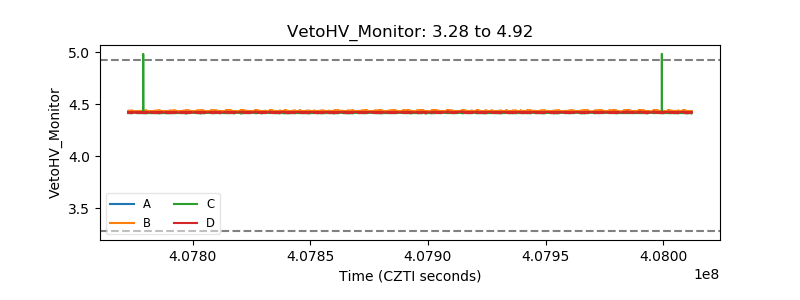 |
| Veto LLD | 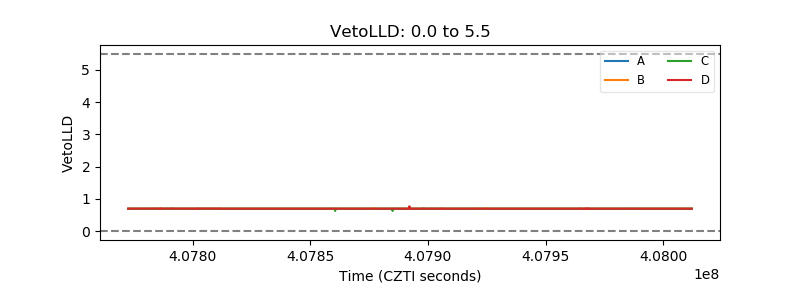 |
| Alpha Counter |  |
| _CPM_Rate | 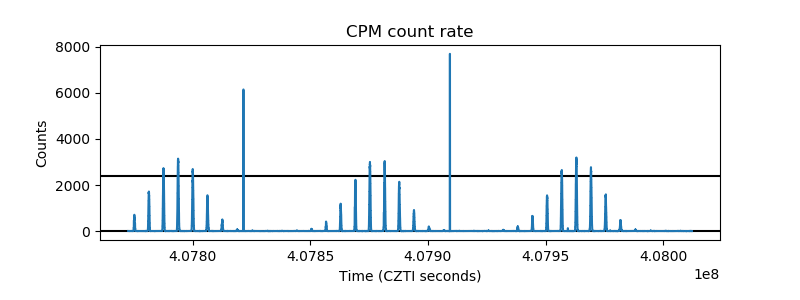 |
| CZT Counter | 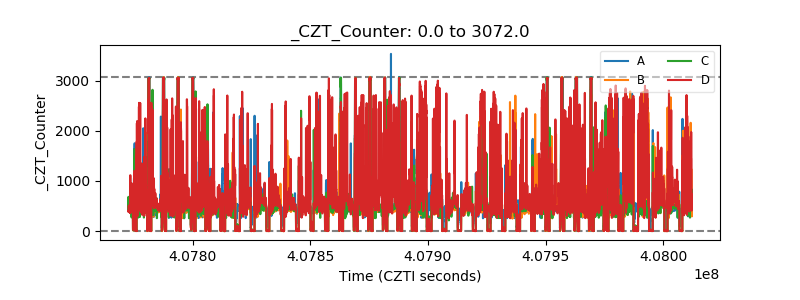 |
| +2.5 Volts monitor | 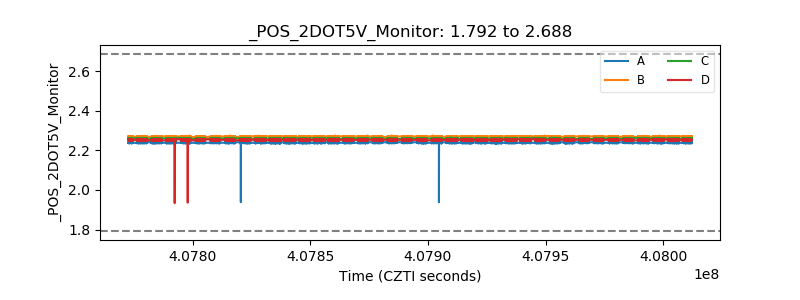 |
| +5 Volts monitor |  |
| _ROLL_ROT |  |
| _Roll_DEC | 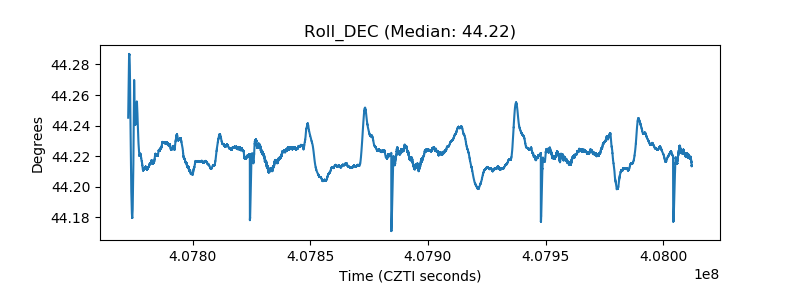 |
| _Roll_RA | 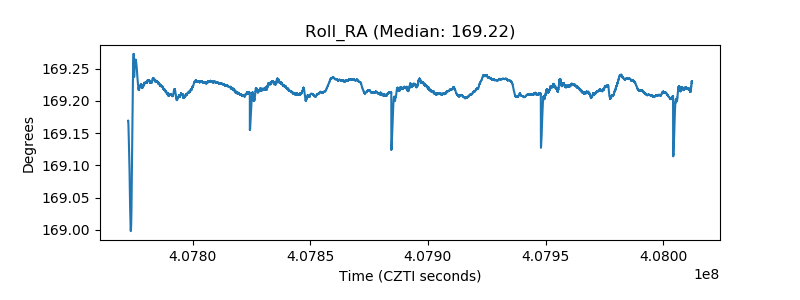 |
| Veto Counter |  |