| Param | Original file | Final file |
|---|---|---|
| Filename | modeM0/AS1A12_083T07_9000005406cztM0_level2.fits | modeM0/AS1A12_083T07_9000005406cztM0_level2_quad_clean.evt |
| Size (bytes) | 114,027,840 | 93,545,280 |
| Size | 108.7 MB | 89.2 MB |
| Events in quadrant A | 682,716 | 518,810 |
| Events in quadrant B | 643,982 | 503,552 |
| Events in quadrant C | 668,872 | 479,037 |
| Events in quadrant D | 573,438 | 446,335 |
| Mode M9 | |||
|---|---|---|---|
| Quadrant | BADHDUFLAG | Total packets | Discarded packets |
| A | 0 | 41 | 0 |
| B | 0 | 41 | 0 |
| C | 0 | 41 | 0 |
| D | 0 | 41 | 0 |
| Mode M0 | |||
|---|---|---|---|
| Quadrant | BADHDUFLAG | Total packets | Discarded packets |
| A | 0 | 27312 | 0 |
| B | 0 | 30577 | 0 |
| C | 0 | 26741 | 0 |
| D | 0 | 32073 | 0 |
| Mode SS | |||
|---|---|---|---|
| Quadrant | BADHDUFLAG | Total packets | Discarded packets |
| A | 0 | 262 | 0 |
| B | 0 | 262 | 0 |
| C | 0 | 262 | 0 |
| D | 0 | 262 | 0 |
| Quadrant | Total seconds | Saturated seconds | Saturation percentage |
|---|---|---|---|
| A | 12795 | 29 | 0.226651% |
| B | 12795 | 474 | 3.704572% |
| C | 12795 | 69 | 0.539273% |
| D | 12795 | 331 | 2.586948% |
Noise dominated data is calculated using 1-second bins in cleaned event files. If a bin has >2000 counts, and if more than 50% of those come from <1% of pixels, then it is considered to be noise-dominated and hence unusable.
| Quadrant | # 1 sec bins | Bins with >0 counts | Bins with >2000 counts | High rate bins dominated by noise | Noise dominated (total time) | Noise dominated (detector-on time) | Marked lightcurve |
|---|---|---|---|---|---|---|---|
| A | 16885 | 12795 | 0 | 0 | 0.00% | 0.00% | 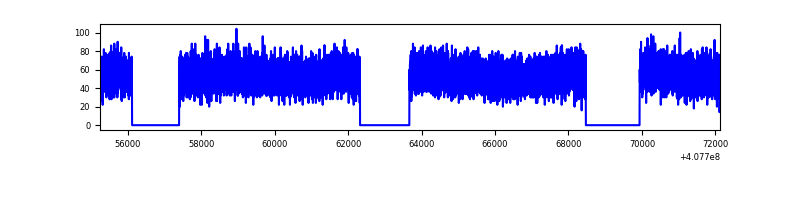 |
| B | 16885 | 12794 | 0 | 0 | 0.00% | 0.00% | 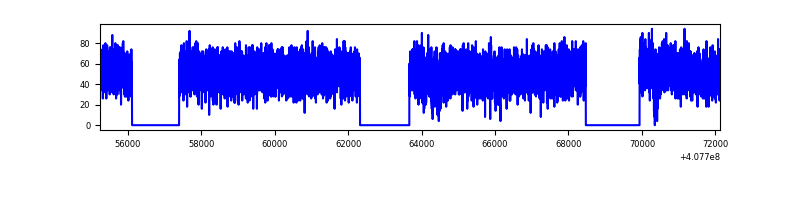 |
| C | 16885 | 12795 | 0 | 0 | 0.00% | 0.00% | 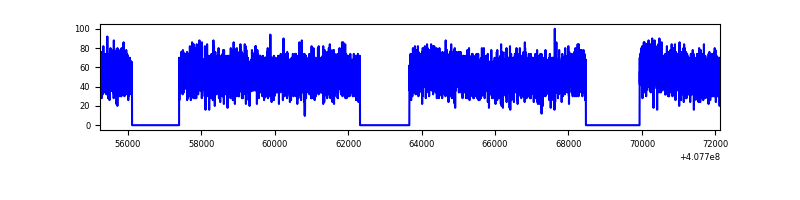 |
| D | 16885 | 12794 | 0 | 0 | 0.00% | 0.00% |  |
Top three noisy pixels from each quadrant. If the there are fewer than three noisy pixels in the level2.evt file, extra rows are filled as -1
| Pixel properties | Quadrant properties | ||||||
|---|---|---|---|---|---|---|---|
| Quadrant | DetID | PixID | Counts | Sigma | Mean | Median | Sigma |
| A | 7 | 110 | 568 | 8.6 | 178 | 166 | 46.7 |
| A | 9 | 19 | 559 | 8.41 | 178 | 166 | 46.7 |
| A | 0 | 29 | 542 | 8.04 | 178 | 166 | 46.7 |
| B | 2 | 9 | 565 | 11.39 | 169 | 161 | 35.5 |
| B | 3 | 80 | 473 | 8.79 | 169 | 161 | 35.5 |
| B | 2 | 8 | 458 | 8.37 | 169 | 161 | 35.5 |
| C | 1 | 80 | 561 | 8.47 | 176 | 164 | 46.9 |
| C | 3 | 202 | 545 | 8.13 | 176 | 164 | 46.9 |
| C | 1 | 81 | 537 | 7.96 | 176 | 164 | 46.9 |
| D | 7 | 3 | 421 | 6.0 | 163 | 149 | 45.3 |
| D | 1 | 3 | 419 | 5.95 | 163 | 149 | 45.3 |
| D | 10 | 189 | 418 | 5.93 | 163 | 149 | 45.3 |
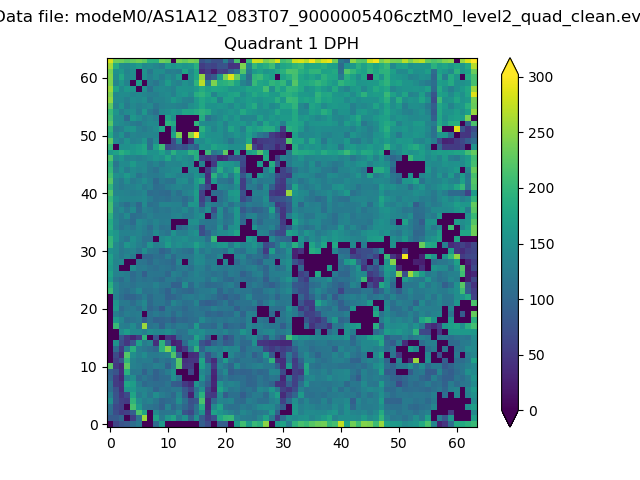
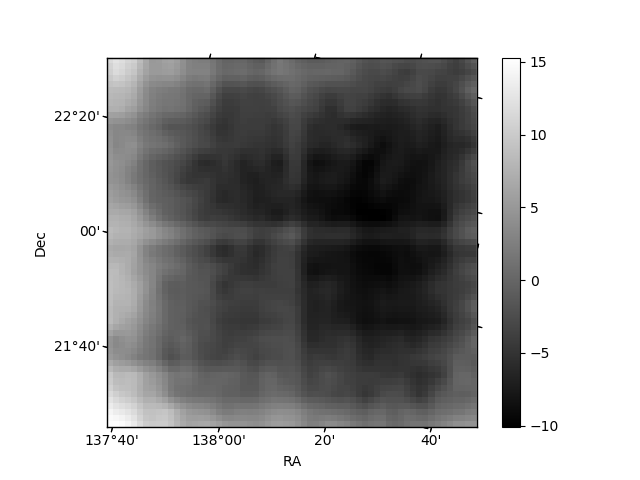
Histogram calculated using DETX and DETY for each event in the final _common_clean file
| Quadrant A |  |
 |
Quadrant B |
|---|---|---|---|
| Quadrant D |  |
 |
Quadrant C |
| Plot type | Count rate plots | Images |
|---|---|---|
| Comparison with Poisson distribution Blue bars denote a histogram of data divided into 1 sec bins. Red curve is a Poisson curve with rate = median count rate of data. |
 |
 |
| Quadrant-wise count rates Data is divided into 100 sec bins |
 |
|
| Module-wise count rates for Quadrant A Data is divided into 100 sec bins |
 |
 |
| Module-wise count rates for Quadrant B Data is divided into 100 sec bins |
 |
 |
| Module-wise count rates for Quadrant C Data is divided into 100 sec bins |
 |
 |
| Module-wise count rates for Quadrant D Data is divided into 100 sec bins |
 |
 |
| Parameter | Plot |
|---|---|
| CZT HV Monitor |  |
| D_VDD |  |
| Temperature 1 |  |
| Veto HV Monitor |  |
| Veto LLD | 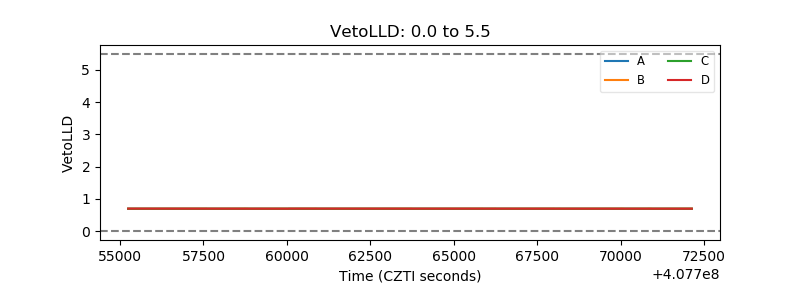 |
| Alpha Counter |  |
| _CPM_Rate | 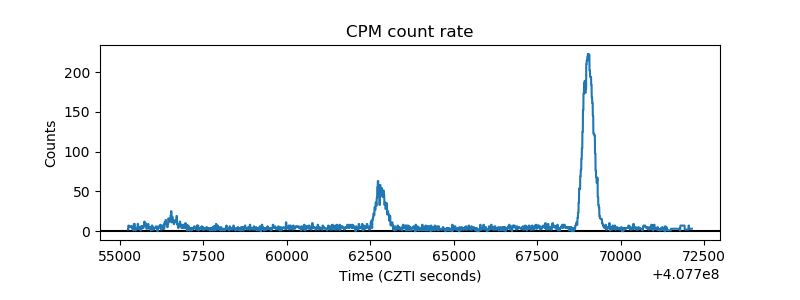 |
| CZT Counter |  |
| +2.5 Volts monitor |  |
| +5 Volts monitor |  |
| _ROLL_ROT | 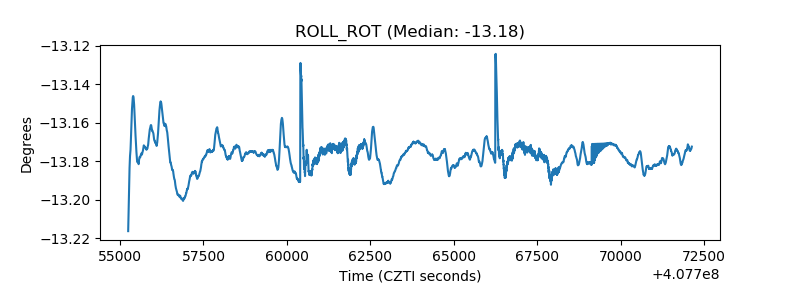 |
| _Roll_DEC |  |
| _Roll_RA | 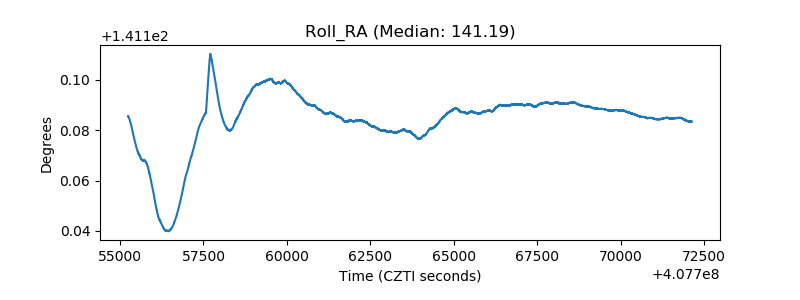 |
| Veto Counter |  |