| Param | Original file | Final file |
|---|---|---|
| Filename | modeM0/AS1A12_011T42_9000005412cztM0_level2.fits | modeM0/AS1A12_011T42_9000005412cztM0_level2_quad_clean.evt |
| Size (bytes) | 185,195,520 | 220,377,600 |
| Size | 176.6 MB | 210.2 MB |
| Events in quadrant A | 1,146,862 | 1,414,245 |
| Events in quadrant B | 1,107,750 | 1,437,523 |
| Events in quadrant C | 1,137,074 | 1,375,759 |
| Events in quadrant D | 879,554 | 1,110,166 |
| Mode SS | |||
|---|---|---|---|
| Quadrant | BADHDUFLAG | Total packets | Discarded packets |
| A | 0 | 398 | 0 |
| B | 0 | 398 | 0 |
| C | 0 | 398 | 0 |
| D | 0 | 398 | 0 |
| Mode M9 | |||
|---|---|---|---|
| Quadrant | BADHDUFLAG | Total packets | Discarded packets |
| A | 0 | 100 | 0 |
| B | 0 | 100 | 0 |
| C | 0 | 100 | 0 |
| D | 0 | 100 | 0 |
| Mode M0 | |||
|---|---|---|---|
| Quadrant | BADHDUFLAG | Total packets | Discarded packets |
| A | 0 | 43681 | 0 |
| B | 0 | 41213 | 0 |
| C | 0 | 40736 | 0 |
| D | 0 | 69856 | 0 |
| Quadrant | Total seconds | Saturated seconds | Saturation percentage |
|---|---|---|---|
| A | 19401 | 156 | 0.804082% |
| B | 19401 | 104 | 0.536055% |
| C | 19401 | 35 | 0.180403% |
| D | 19401 | 3192 | 16.452760% |
Noise dominated data is calculated using 1-second bins in cleaned event files. If a bin has >2000 counts, and if more than 50% of those come from <1% of pixels, then it is considered to be noise-dominated and hence unusable.
| Quadrant | # 1 sec bins | Bins with >0 counts | Bins with >2000 counts | High rate bins dominated by noise | Noise dominated (total time) | Noise dominated (detector-on time) | Marked lightcurve |
|---|---|---|---|---|---|---|---|
| A | 29445 | 19401 | 0 | 0 | 0.00% | 0.00% |  |
| B | 29445 | 19401 | 0 | 0 | 0.00% | 0.00% |  |
| C | 29445 | 19401 | 0 | 0 | 0.00% | 0.00% | 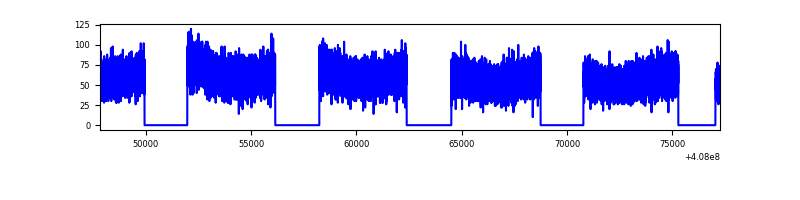 |
| D | 29444 | 19204 | 0 | 0 | 0.00% | 0.00% | 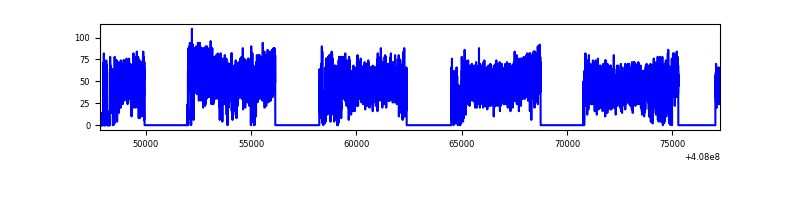 |
Top three noisy pixels from each quadrant. If the there are fewer than three noisy pixels in the level2.evt file, extra rows are filled as -1
| Pixel properties | Quadrant properties | ||||||
|---|---|---|---|---|---|---|---|
| Quadrant | DetID | PixID | Counts | Sigma | Mean | Median | Sigma |
| A | 7 | 110 | 934 | 8.61 | 299 | 282 | 75.8 |
| A | 9 | 19 | 914 | 8.34 | 299 | 282 | 75.8 |
| A | 0 | 29 | 889 | 8.01 | 299 | 282 | 75.8 |
| B | 2 | 9 | 988 | 11.89 | 292 | 280 | 59.5 |
| B | 3 | 80 | 889 | 10.23 | 292 | 280 | 59.5 |
| B | 5 | 128 | 798 | 8.7 | 292 | 280 | 59.5 |
| C | 1 | 81 | 934 | 8.34 | 301 | 283 | 78.1 |
| C | 3 | 203 | 920 | 8.16 | 301 | 283 | 78.1 |
| C | 1 | 80 | 916 | 8.11 | 301 | 283 | 78.1 |
| D | 10 | 113 | 639 | 6.02 | 251 | 231 | 67.8 |
| D | 4 | 160 | 631 | 5.9 | 251 | 231 | 67.8 |
| D | 6 | 83 | 625 | 5.81 | 251 | 231 | 67.8 |
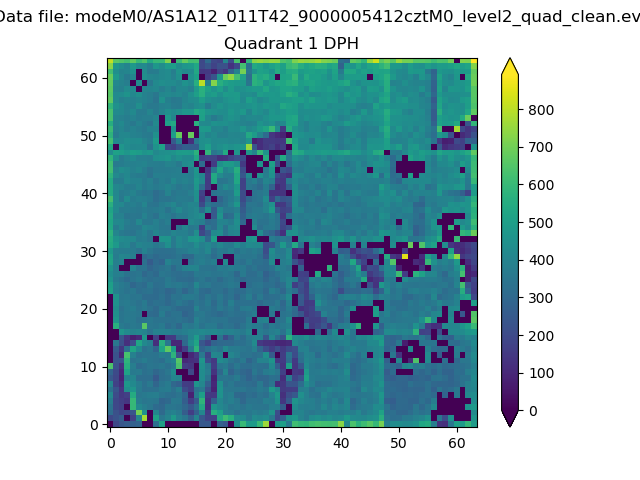
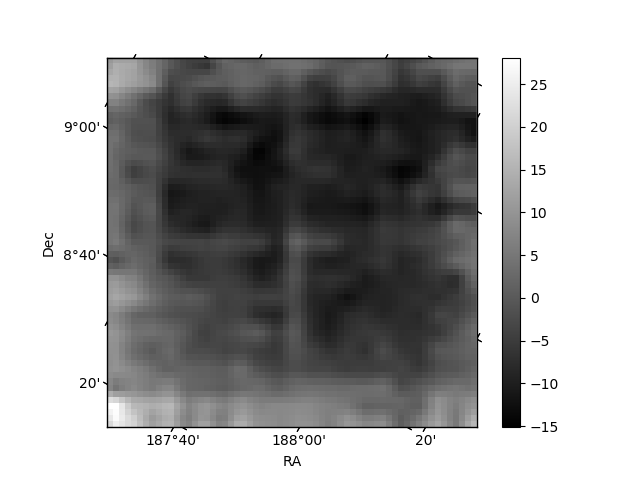
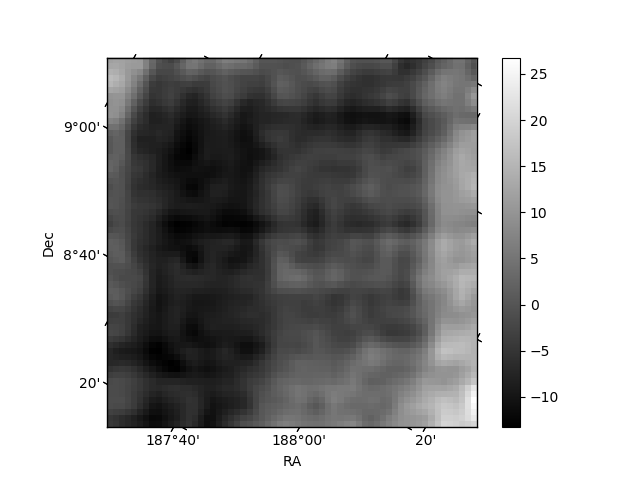
Histogram calculated using DETX and DETY for each event in the final _common_clean file
| Quadrant A |  |
 |
Quadrant B |
|---|---|---|---|
| Quadrant D | 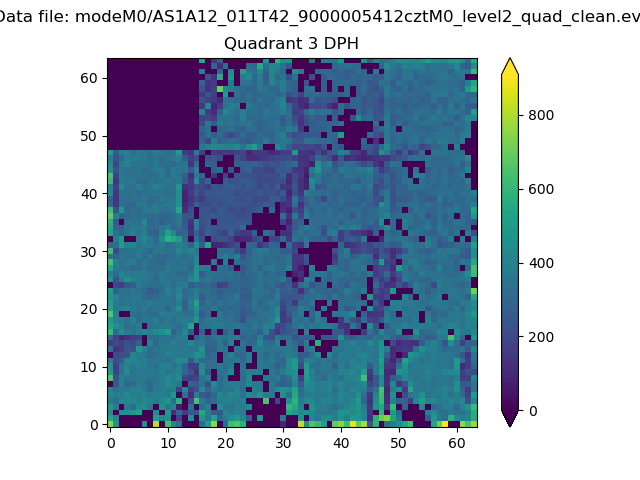 |
 |
Quadrant C |
| Plot type | Count rate plots | Images |
|---|---|---|
| Comparison with Poisson distribution Blue bars denote a histogram of data divided into 1 sec bins. Red curve is a Poisson curve with rate = median count rate of data. |
 |
 |
| Quadrant-wise count rates Data is divided into 100 sec bins |
 |
|
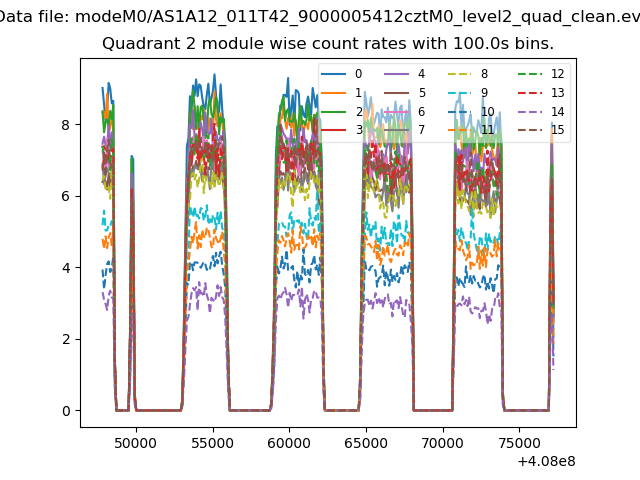
| Module-wise count rates for Quadrant A Data is divided into 100 sec bins |
 |
 |
| Module-wise count rates for Quadrant B Data is divided into 100 sec bins |
 |
 |
| Module-wise count rates for Quadrant C Data is divided into 100 sec bins |
 |
 |
| Module-wise count rates for Quadrant D Data is divided into 100 sec bins |
 |
 |
| Parameter | Plot |
|---|---|
| CZT HV Monitor |  |
| D_VDD | 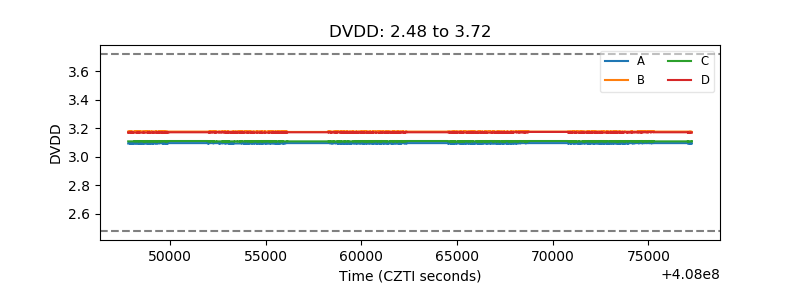 |
| Temperature 1 | 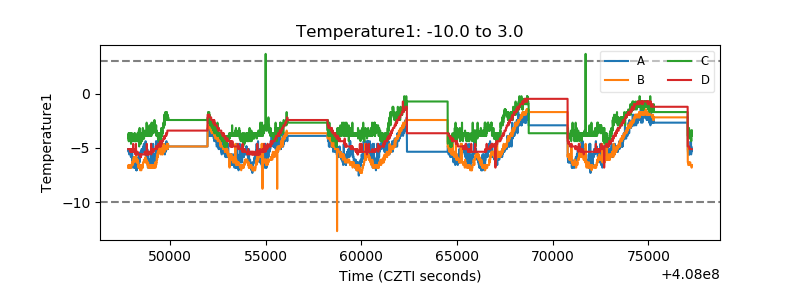 |
| Veto HV Monitor |  |
| Veto LLD |  |
| Alpha Counter |  |
| _CPM_Rate |  |
| CZT Counter |  |
| +2.5 Volts monitor |  |
| +5 Volts monitor | 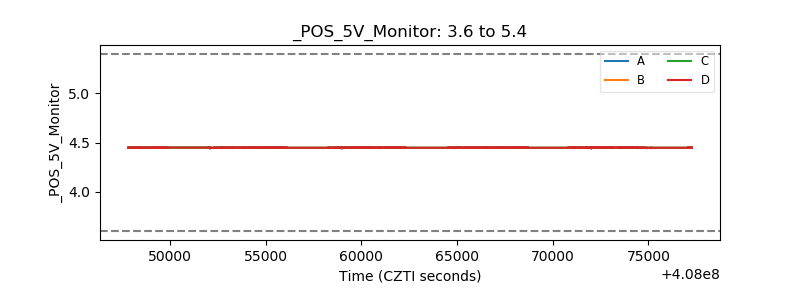 |
| _ROLL_ROT |  |
| _Roll_DEC | 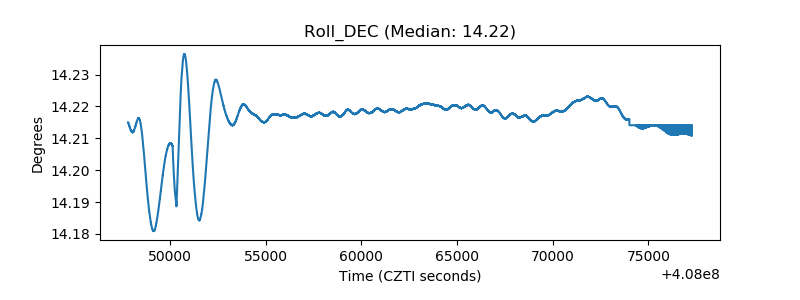 |
| _Roll_RA |  |
| Veto Counter | 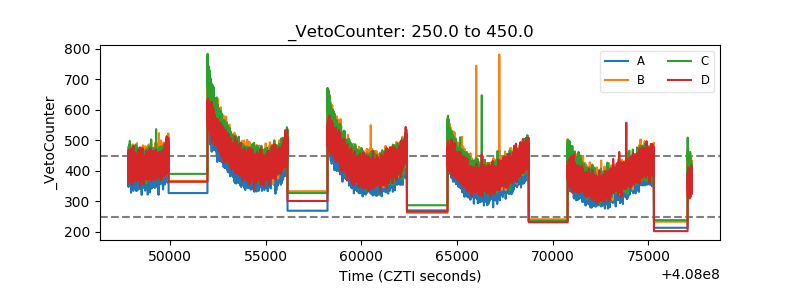 |