| Param | Original file | Final file |
|---|---|---|
| Filename | modeM0/AS1A12_095T02_9000005420cztM0_level2.fits | modeM0/AS1A12_095T02_9000005420cztM0_level2_quad_clean.evt |
| Size (bytes) | 501,799,680 | 510,560,640 |
| Size | 478.6 MB | 486.9 MB |
| Events in quadrant A | 2,989,184 | 2,974,746 |
| Events in quadrant B | 2,946,424 | 3,141,935 |
| Events in quadrant C | 3,036,384 | 3,011,562 |
| Events in quadrant D | 2,543,906 | 2,655,583 |
| Mode M0 | |||
|---|---|---|---|
| Quadrant | BADHDUFLAG | Total packets | Discarded packets |
| A | 0 | 144054 | 0 |
| B | 0 | 113037 | 0 |
| C | 0 | 111290 | 0 |
| D | 0 | 166148 | 0 |
| Mode SS | |||
|---|---|---|---|
| Quadrant | BADHDUFLAG | Total packets | Discarded packets |
| A | 0 | 1092 | 0 |
| B | 0 | 1092 | 0 |
| C | 0 | 1092 | 0 |
| D | 0 | 1092 | 0 |
| Mode M9 | |||
|---|---|---|---|
| Quadrant | BADHDUFLAG | Total packets | Discarded packets |
| A | 0 | 216 | 0 |
| B | 0 | 217 | 0 |
| C | 0 | 217 | 0 |
| D | 0 | 217 | 0 |
| Quadrant | Total seconds | Saturated seconds | Saturation percentage |
|---|---|---|---|
| A | 53631 | 3120 | 5.817531% |
| B | 53631 | 430 | 0.801775% |
| C | 53631 | 81 | 0.151032% |
| D | 53631 | 4131 | 7.702635% |
Noise dominated data is calculated using 1-second bins in cleaned event files. If a bin has >2000 counts, and if more than 50% of those come from <1% of pixels, then it is considered to be noise-dominated and hence unusable.
| Quadrant | # 1 sec bins | Bins with >0 counts | Bins with >2000 counts | High rate bins dominated by noise | Noise dominated (total time) | Noise dominated (detector-on time) | Marked lightcurve |
|---|---|---|---|---|---|---|---|
| A | 80131 | 53614 | 0 | 0 | 0.00% | 0.00% |  |
| B | 80131 | 53627 | 0 | 0 | 0.00% | 0.00% |  |
| C | 80131 | 53631 | 0 | 0 | 0.00% | 0.00% | 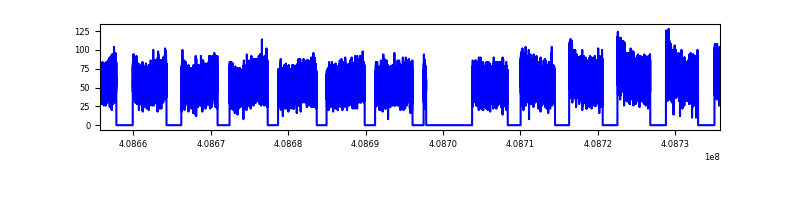 |
| D | 80130 | 53496 | 0 | 0 | 0.00% | 0.00% |  |
Top three noisy pixels from each quadrant. If the there are fewer than three noisy pixels in the level2.evt file, extra rows are filled as -1
| Pixel properties | Quadrant properties | ||||||
|---|---|---|---|---|---|---|---|
| Quadrant | DetID | PixID | Counts | Sigma | Mean | Median | Sigma |
| A | 9 | 19 | 2454 | 8.8 | 780 | 730 | 195.9 |
| A | 0 | 29 | 2405 | 8.55 | 780 | 730 | 195.9 |
| A | 7 | 110 | 2394 | 8.49 | 780 | 730 | 195.9 |
| B | 2 | 9 | 2528 | 11.5 | 779 | 741 | 155.5 |
| B | 3 | 80 | 2340 | 10.29 | 779 | 741 | 155.5 |
| B | 3 | 17 | 2083 | 8.63 | 779 | 741 | 155.5 |
| C | 1 | 81 | 2420 | 8.13 | 803 | 754 | 205.0 |
| C | 3 | 203 | 2394 | 8.0 | 803 | 754 | 205.0 |
| C | 3 | 202 | 2372 | 7.89 | 803 | 754 | 205.0 |
| D | 10 | 189 | 1883 | 6.35 | 726 | 665 | 191.8 |
| D | 7 | 3 | 1870 | 6.28 | 726 | 665 | 191.8 |
| D | 10 | 113 | 1821 | 6.03 | 726 | 665 | 191.8 |
Histogram calculated using DETX and DETY for each event in the final _common_clean file
| Quadrant A | 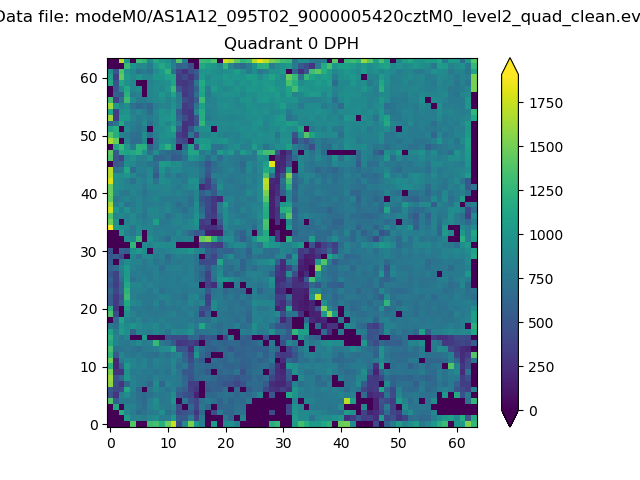 |
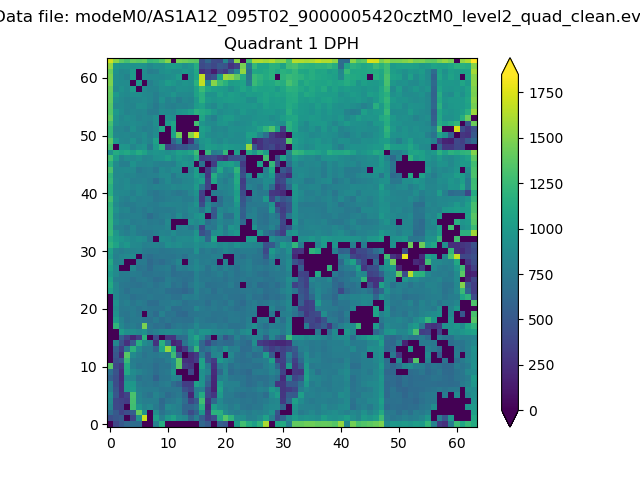 |
Quadrant B |
|---|---|---|---|
| Quadrant D |  |
 |
Quadrant C |
| Plot type | Count rate plots | Images |
|---|---|---|
| Comparison with Poisson distribution Blue bars denote a histogram of data divided into 1 sec bins. Red curve is a Poisson curve with rate = median count rate of data. |
 |
 |
| Quadrant-wise count rates Data is divided into 100 sec bins |
 |
|
| Module-wise count rates for Quadrant A Data is divided into 100 sec bins |
 |
 |
| Module-wise count rates for Quadrant B Data is divided into 100 sec bins |
 |
 |
| Module-wise count rates for Quadrant C Data is divided into 100 sec bins |
 |
 |
| Module-wise count rates for Quadrant D Data is divided into 100 sec bins |
 |
 |
| Parameter | Plot |
|---|---|
| CZT HV Monitor |  |
| D_VDD | 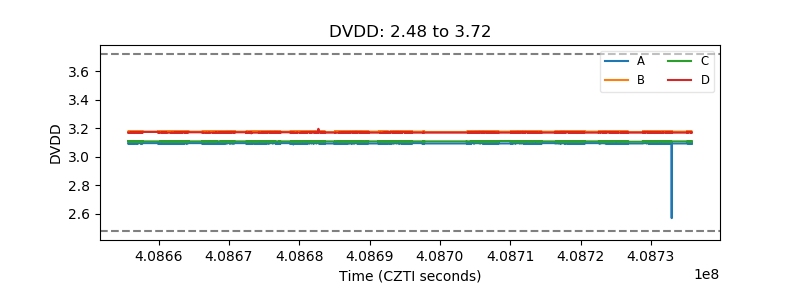 |
| Temperature 1 |  |
| Veto HV Monitor |  |
| Veto LLD | 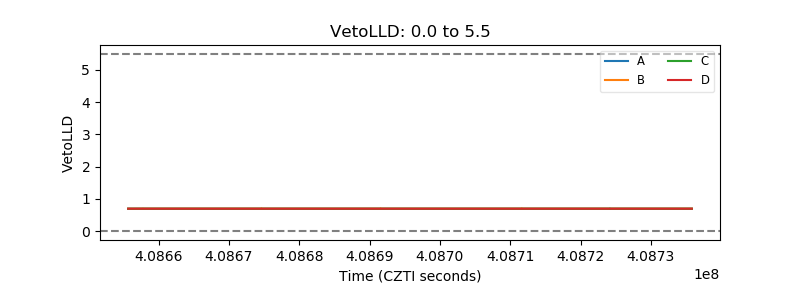 |
| Alpha Counter |  |
| _CPM_Rate |  |
| CZT Counter |  |
| +2.5 Volts monitor |  |
| +5 Volts monitor |  |
| _ROLL_ROT |  |
| _Roll_DEC | 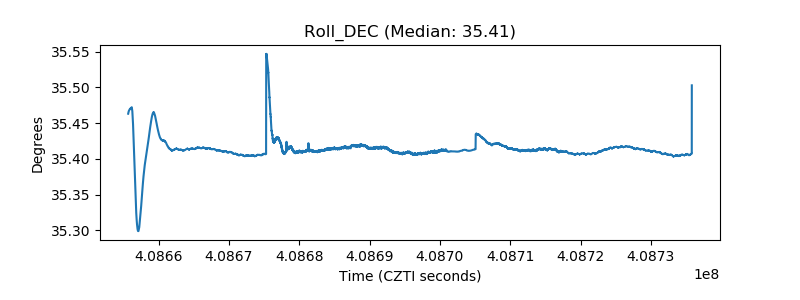 |
| _Roll_RA |  |
| Veto Counter |  |