| Param | Original file | Final file |
|---|---|---|
| Filename | modeM0/AS1C06_010T05_9000005424cztM0_level2.fits | modeM0/AS1C06_010T05_9000005424cztM0_level2_quad_clean.evt |
| Size (bytes) | 120,939,840 | 191,707,200 |
| Size | 115.3 MB | 182.8 MB |
| Events in quadrant A | 708,158 | 1,254,115 |
| Events in quadrant B | 686,628 | 1,272,503 |
| Events in quadrant C | 712,068 | 1,220,398 |
| Events in quadrant D | 614,390 | 1,117,842 |
| Mode SS | |||
|---|---|---|---|
| Quadrant | BADHDUFLAG | Total packets | Discarded packets |
| A | 0 | 276 | 0 |
| B | 0 | 276 | 0 |
| C | 0 | 276 | 0 |
| D | 0 | 276 | 0 |
| Mode M9 | |||
|---|---|---|---|
| Quadrant | BADHDUFLAG | Total packets | Discarded packets |
| A | 0 | 34 | 0 |
| B | 0 | 34 | 0 |
| C | 0 | 34 | 0 |
| D | 0 | 34 | 0 |
| Mode M0 | |||
|---|---|---|---|
| Quadrant | BADHDUFLAG | Total packets | Discarded packets |
| A | 0 | 34403 | 0 |
| B | 0 | 30515 | 0 |
| C | 0 | 27678 | 0 |
| D | 0 | 31767 | 0 |
| Quadrant | Total seconds | Saturated seconds | Saturation percentage |
|---|---|---|---|
| A | 13631 | 447 | 3.279290% |
| B | 13631 | 304 | 2.230211% |
| C | 13631 | 37 | 0.271440% |
| D | 13631 | 154 | 1.129778% |
Noise dominated data is calculated using 1-second bins in cleaned event files. If a bin has >2000 counts, and if more than 50% of those come from <1% of pixels, then it is considered to be noise-dominated and hence unusable.
| Quadrant | # 1 sec bins | Bins with >0 counts | Bins with >2000 counts | High rate bins dominated by noise | Noise dominated (total time) | Noise dominated (detector-on time) | Marked lightcurve |
|---|---|---|---|---|---|---|---|
| A | 16526 | 13628 | 0 | 0 | 0.00% | 0.00% |  |
| B | 16526 | 13629 | 0 | 0 | 0.00% | 0.00% |  |
| C | 16525 | 13625 | 0 | 0 | 0.00% | 0.00% |  |
| D | 16526 | 13628 | 0 | 0 | 0.00% | 0.00% | 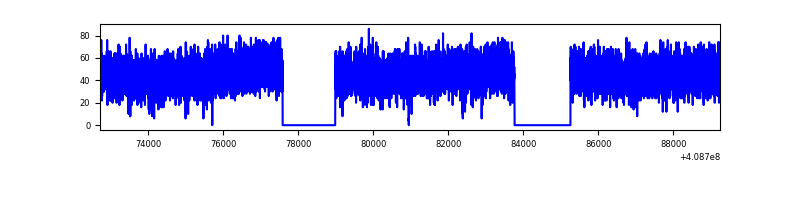 |
Top three noisy pixels from each quadrant. If the there are fewer than three noisy pixels in the level2.evt file, extra rows are filled as -1
| Pixel properties | Quadrant properties | ||||||
|---|---|---|---|---|---|---|---|
| Quadrant | DetID | PixID | Counts | Sigma | Mean | Median | Sigma |
| A | 7 | 110 | 593 | 8.53 | 185 | 174 | 49.1 |
| A | 9 | 19 | 574 | 8.14 | 185 | 174 | 49.1 |
| A | 0 | 29 | 548 | 7.62 | 185 | 174 | 49.1 |
| B | 2 | 9 | 592 | 11.06 | 181 | 173 | 37.9 |
| B | 3 | 17 | 550 | 9.95 | 181 | 173 | 37.9 |
| B | 5 | 255 | 501 | 8.65 | 181 | 173 | 37.9 |
| C | 1 | 81 | 560 | 7.7 | 188 | 176 | 49.8 |
| C | 1 | 80 | 550 | 7.5 | 188 | 176 | 49.8 |
| C | 3 | 187 | 487 | 6.24 | 188 | 176 | 49.8 |
| D | 4 | 160 | 469 | 6.41 | 175 | 160 | 48.2 |
| D | 6 | 83 | 456 | 6.14 | 175 | 160 | 48.2 |
| D | 10 | 189 | 440 | 5.81 | 175 | 160 | 48.2 |
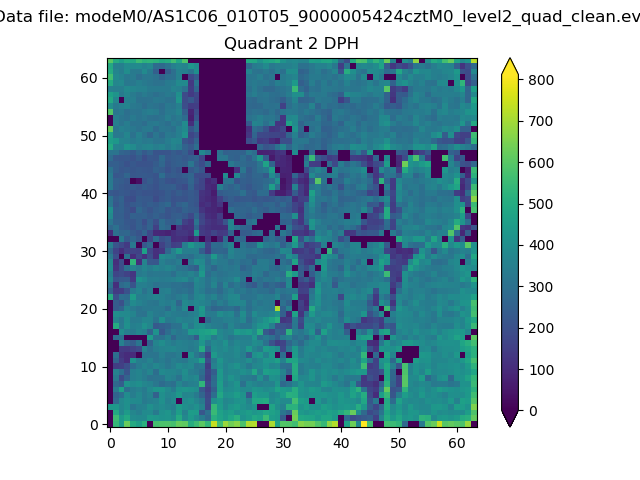
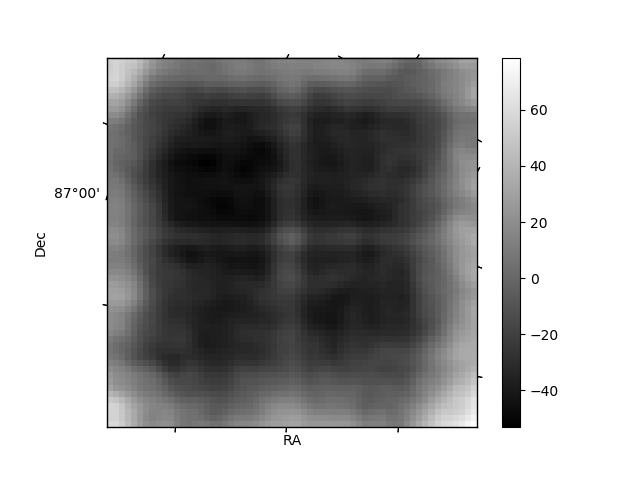
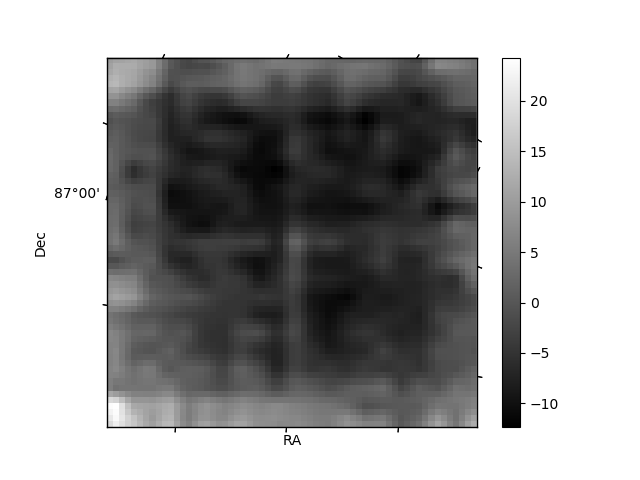
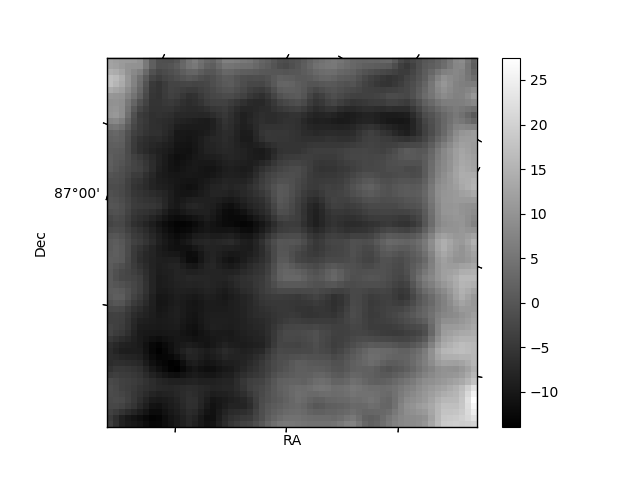
Histogram calculated using DETX and DETY for each event in the final _common_clean file
| Quadrant A |  |
 |
Quadrant B |
|---|---|---|---|
| Quadrant D |  |
 |
Quadrant C |
| Plot type | Count rate plots | Images |
|---|---|---|
| Comparison with Poisson distribution Blue bars denote a histogram of data divided into 1 sec bins. Red curve is a Poisson curve with rate = median count rate of data. |
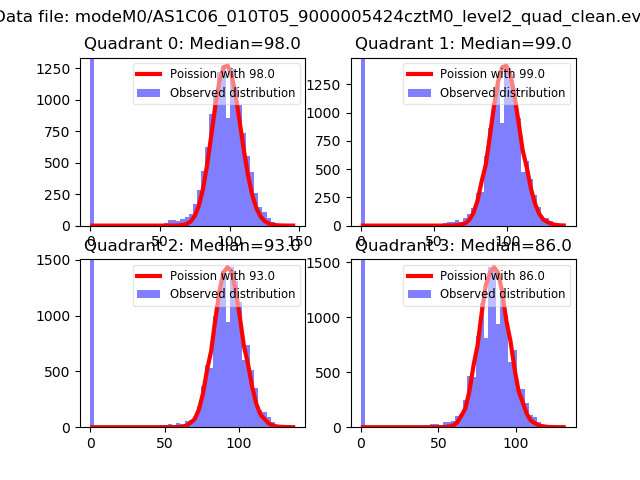 |
 |
| Quadrant-wise count rates Data is divided into 100 sec bins |
 |
|
| Module-wise count rates for Quadrant A Data is divided into 100 sec bins |
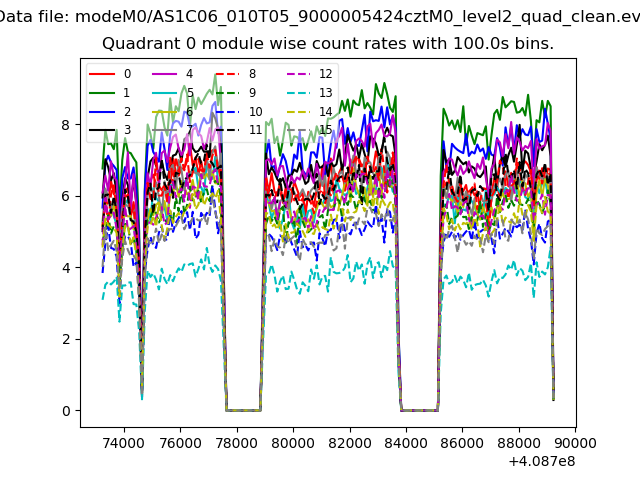 |
 |
| Module-wise count rates for Quadrant B Data is divided into 100 sec bins |
 |
 |
| Module-wise count rates for Quadrant C Data is divided into 100 sec bins |
 |
 |
| Module-wise count rates for Quadrant D Data is divided into 100 sec bins |
 |
 |
| Parameter | Plot |
|---|---|
| CZT HV Monitor |  |
| D_VDD |  |
| Temperature 1 |  |
| Veto HV Monitor |  |
| Veto LLD | 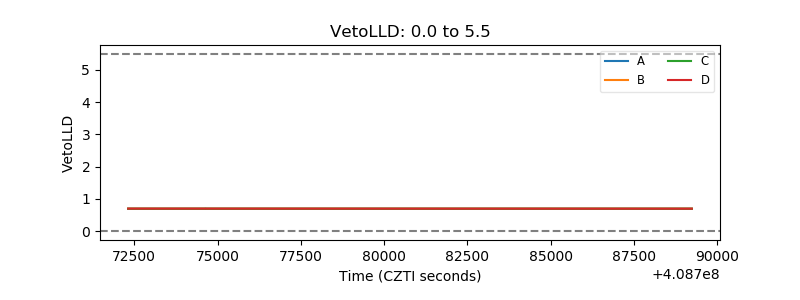 |
| Alpha Counter | 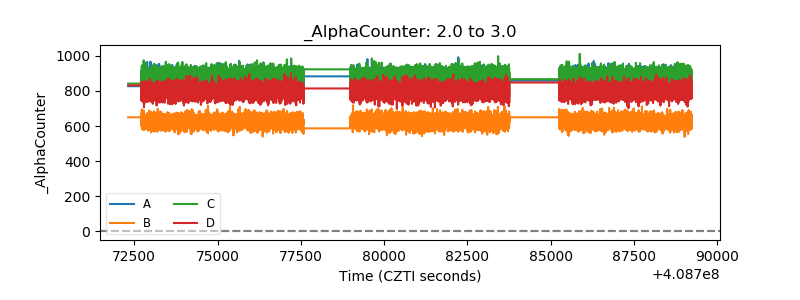 |
| _CPM_Rate |  |
| CZT Counter |  |
| +2.5 Volts monitor | 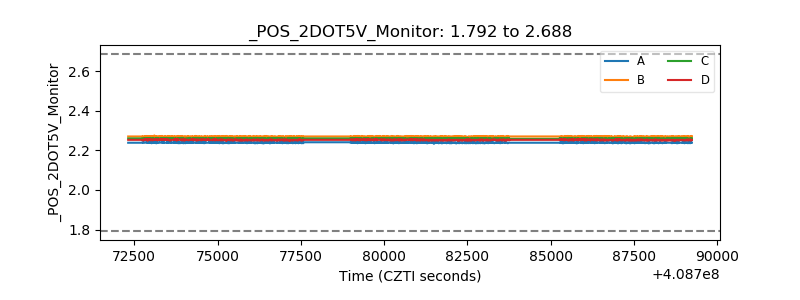 |
| +5 Volts monitor |  |
| _ROLL_ROT |  |
| _Roll_DEC |  |
| _Roll_RA |  |
| Veto Counter |  |