| Param | Original file | Final file |
|---|---|---|
| Filename | modeM0/AS1T05_067T01_9000005432cztM0_level2.fits | modeM0/AS1T05_067T01_9000005432cztM0_level2_quad_clean.evt |
| Size (bytes) | 1,798,035,840 | 1,938,818,880 |
| Size | 1.7 GB | 1.8 GB |
| Events in quadrant A | 10,943,088 | 12,045,615 |
| Events in quadrant B | 10,590,980 | 12,088,376 |
| Events in quadrant C | 10,482,930 | 11,108,062 |
| Events in quadrant D | 9,080,340 | 10,127,448 |
| Mode M0 | |||
|---|---|---|---|
| Quadrant | BADHDUFLAG | Total packets | Discarded packets |
| A | 0 | 484340 | 0 |
| B | 0 | 410275 | 0 |
| C | 0 | 523212 | 0 |
| D | 0 | 580154 | 0 |
| Mode SS | |||
|---|---|---|---|
| Quadrant | BADHDUFLAG | Total packets | Discarded packets |
| A | 0 | 3980 | 0 |
| B | 0 | 3986 | 0 |
| C | 0 | 3984 | 0 |
| D | 0 | 3982 | 0 |
| Mode M9 | |||
|---|---|---|---|
| Quadrant | BADHDUFLAG | Total packets | Discarded packets |
| A | 0 | 780 | 0 |
| B | 0 | 780 | 0 |
| C | 0 | 779 | 0 |
| D | 0 | 782 | 0 |
| Quadrant | Total seconds | Saturated seconds | Saturation percentage |
|---|---|---|---|
| A | 195001 | 1457 | 0.747176% |
| B | 194977 | 1064 | 0.545705% |
| C | 194825 | 5469 | 2.807135% |
| D | 194887 | 8280 | 4.248616% |
Noise dominated data is calculated using 1-second bins in cleaned event files. If a bin has >2000 counts, and if more than 50% of those come from <1% of pixels, then it is considered to be noise-dominated and hence unusable.
| Quadrant | # 1 sec bins | Bins with >0 counts | Bins with >2000 counts | High rate bins dominated by noise | Noise dominated (total time) | Noise dominated (detector-on time) | Marked lightcurve |
|---|---|---|---|---|---|---|---|
| A | 277131 | 195325 | 0 | 0 | 0.00% | 0.00% |  |
| B | 277131 | 195312 | 0 | 0 | 0.00% | 0.00% |  |
| C | 277131 | 195146 | 0 | 0 | 0.00% | 0.00% |  |
| D | 277131 | 195210 | 0 | 0 | 0.00% | 0.00% |  |
Top three noisy pixels from each quadrant. If the there are fewer than three noisy pixels in the level2.evt file, extra rows are filled as -1
| Pixel properties | Quadrant properties | ||||||
|---|---|---|---|---|---|---|---|
| Quadrant | DetID | PixID | Counts | Sigma | Mean | Median | Sigma |
| A | 9 | 19 | 9028 | 8.94 | 2854 | 2676 | 710.9 |
| A | 7 | 110 | 9010 | 8.91 | 2854 | 2676 | 710.9 |
| A | 0 | 29 | 8827 | 8.65 | 2854 | 2676 | 710.9 |
| B | 2 | 9 | 8878 | 11.48 | 2797 | 2673 | 540.4 |
| B | 3 | 80 | 8224 | 10.27 | 2797 | 2673 | 540.4 |
| B | 5 | 255 | 7367 | 8.69 | 2797 | 2673 | 540.4 |
| C | 1 | 81 | 8550 | 8.42 | 2768 | 2601 | 706.9 |
| C | 3 | 202 | 8383 | 8.18 | 2768 | 2601 | 706.9 |
| C | 3 | 203 | 8196 | 7.91 | 2768 | 2601 | 706.9 |
| D | 7 | 3 | 6855 | 6.57 | 2599 | 2376 | 682.1 |
| D | 10 | 189 | 6559 | 6.13 | 2599 | 2376 | 682.1 |
| D | 10 | 113 | 6532 | 6.09 | 2599 | 2376 | 682.1 |
Histogram calculated using DETX and DETY for each event in the final _common_clean file
| Quadrant A |  |
 |
Quadrant B |
|---|---|---|---|
| Quadrant D |  |
 |
Quadrant C |
| Plot type | Count rate plots | Images |
|---|---|---|
| Comparison with Poisson distribution Blue bars denote a histogram of data divided into 1 sec bins. Red curve is a Poisson curve with rate = median count rate of data. |
 |
 |
| Quadrant-wise count rates Data is divided into 100 sec bins |
 |
|
| Module-wise count rates for Quadrant A Data is divided into 100 sec bins |
 |
 |
| Module-wise count rates for Quadrant B Data is divided into 100 sec bins |
 |
 |
| Module-wise count rates for Quadrant C Data is divided into 100 sec bins |
 |
 |
| Module-wise count rates for Quadrant D Data is divided into 100 sec bins |
 |
 |
| Parameter | Plot |
|---|---|
| CZT HV Monitor |  |
| D_VDD | 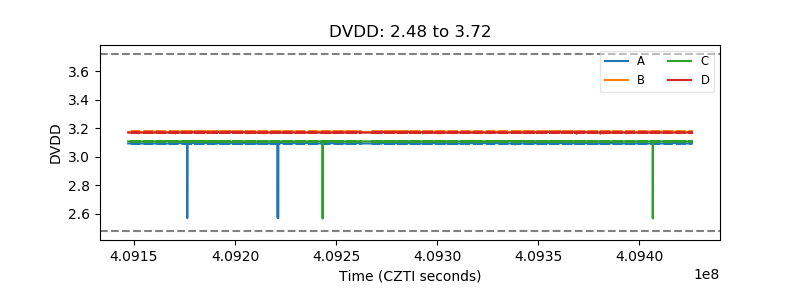 |
| Temperature 1 |  |
| Veto HV Monitor |  |
| Veto LLD |  |
| Alpha Counter |  |
| _CPM_Rate |  |
| CZT Counter |  |
| +2.5 Volts monitor |  |
| +5 Volts monitor |  |
| _ROLL_ROT |  |
| _Roll_DEC |  |
| _Roll_RA |  |
| Veto Counter |  |