| Param | Original file | Final file |
|---|---|---|
| Filename | modeM0/AS1A12_025T11_9000005438cztM0_level2.fits | modeM0/AS1A12_025T11_9000005438cztM0_level2_quad_clean.evt |
| Size (bytes) | 112,224,960 | 129,401,280 |
| Size | 107.0 MB | 123.4 MB |
| Events in quadrant A | 682,046 | 813,941 |
| Events in quadrant B | 657,064 | 811,945 |
| Events in quadrant C | 665,664 | 774,493 |
| Events in quadrant D | 545,086 | 669,845 |
| Mode M9 | |||
|---|---|---|---|
| Quadrant | BADHDUFLAG | Total packets | Discarded packets |
| A | 0 | 61 | 0 |
| B | 0 | 61 | 0 |
| C | 0 | 61 | 0 |
| D | 0 | 61 | 0 |
| Mode M0 | |||
|---|---|---|---|
| Quadrant | BADHDUFLAG | Total packets | Discarded packets |
| A | 0 | 31386 | 0 |
| B | 0 | 25618 | 0 |
| C | 0 | 27387 | 0 |
| D | 0 | 50414 | 0 |
| Mode SS | |||
|---|---|---|---|
| Quadrant | BADHDUFLAG | Total packets | Discarded packets |
| A | 0 | 250 | 0 |
| B | 0 | 250 | 0 |
| C | 0 | 250 | 0 |
| D | 0 | 250 | 0 |
| Quadrant | Total seconds | Saturated seconds | Saturation percentage |
|---|---|---|---|
| A | 12274 | 141 | 1.148770% |
| B | 12274 | 81 | 0.659932% |
| C | 12274 | 106 | 0.863614% |
| D | 12274 | 1803 | 14.689588% |
Noise dominated data is calculated using 1-second bins in cleaned event files. If a bin has >2000 counts, and if more than 50% of those come from <1% of pixels, then it is considered to be noise-dominated and hence unusable.
| Quadrant | # 1 sec bins | Bins with >0 counts | Bins with >2000 counts | High rate bins dominated by noise | Noise dominated (total time) | Noise dominated (detector-on time) | Marked lightcurve |
|---|---|---|---|---|---|---|---|
| A | 18312 | 12274 | 0 | 0 | 0.00% | 0.00% |  |
| B | 18312 | 12274 | 0 | 0 | 0.00% | 0.00% |  |
| C | 18312 | 12274 | 0 | 0 | 0.00% | 0.00% |  |
| D | 18312 | 12270 | 0 | 0 | 0.00% | 0.00% |  |
Top three noisy pixels from each quadrant. If the there are fewer than three noisy pixels in the level2.evt file, extra rows are filled as -1
| Pixel properties | Quadrant properties | ||||||
|---|---|---|---|---|---|---|---|
| Quadrant | DetID | PixID | Counts | Sigma | Mean | Median | Sigma |
| A | 14 | 95 | 551 | 8.43 | 178 | 168 | 45.4 |
| A | 9 | 19 | 548 | 8.36 | 178 | 168 | 45.4 |
| A | 7 | 110 | 543 | 8.25 | 178 | 168 | 45.4 |
| B | 2 | 9 | 557 | 10.79 | 173 | 166 | 36.2 |
| B | 3 | 80 | 513 | 9.57 | 173 | 166 | 36.2 |
| B | 5 | 255 | 477 | 8.58 | 173 | 166 | 36.2 |
| C | 3 | 158 | 471 | 6.54 | 176 | 166 | 46.7 |
| C | 3 | 187 | 449 | 6.06 | 176 | 166 | 46.7 |
| C | 9 | 233 | 445 | 5.98 | 176 | 166 | 46.7 |
| D | 7 | 3 | 480 | 7.92 | 155 | 142 | 42.7 |
| D | 6 | 83 | 433 | 6.82 | 155 | 142 | 42.7 |
| D | 4 | 160 | 411 | 6.3 | 155 | 142 | 42.7 |
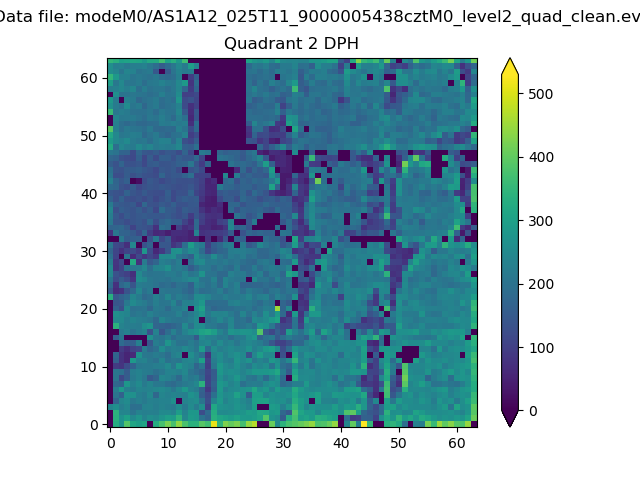
Histogram calculated using DETX and DETY for each event in the final _common_clean file
| Quadrant A |  |
 |
Quadrant B |
|---|---|---|---|
| Quadrant D |  |
 |
Quadrant C |
| Plot type | Count rate plots | Images |
|---|---|---|
| Comparison with Poisson distribution Blue bars denote a histogram of data divided into 1 sec bins. Red curve is a Poisson curve with rate = median count rate of data. |
 |
 |
| Quadrant-wise count rates Data is divided into 100 sec bins |
 |
|
| Module-wise count rates for Quadrant A Data is divided into 100 sec bins |
 |
 |
| Module-wise count rates for Quadrant B Data is divided into 100 sec bins |
 |
 |
| Module-wise count rates for Quadrant C Data is divided into 100 sec bins |
 |
 |
| Module-wise count rates for Quadrant D Data is divided into 100 sec bins |
 |
 |
| Parameter | Plot |
|---|---|
| CZT HV Monitor |  |
| D_VDD | 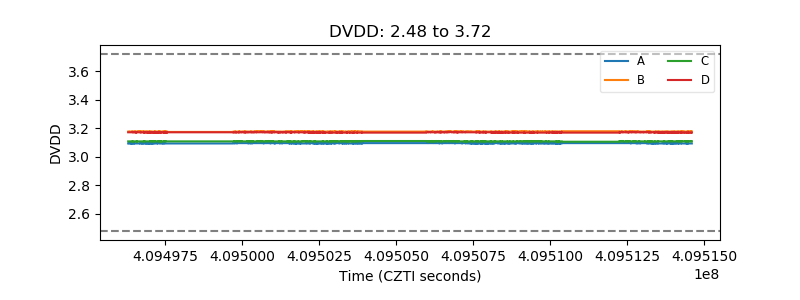 |
| Temperature 1 |  |
| Veto HV Monitor |  |
| Veto LLD |  |
| Alpha Counter | 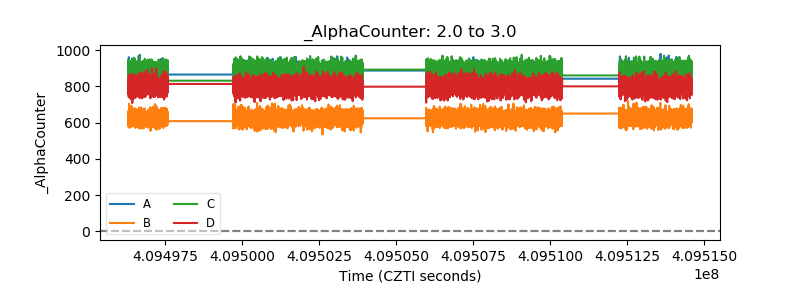 |
| _CPM_Rate |  |
| CZT Counter |  |
| +2.5 Volts monitor |  |
| +5 Volts monitor |  |
| _ROLL_ROT |  |
| _Roll_DEC |  |
| _Roll_RA | 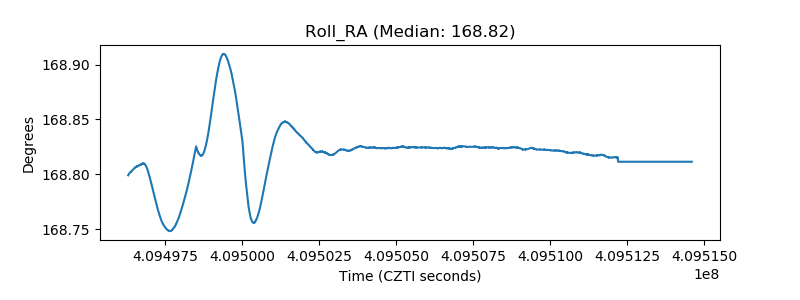 |
| Veto Counter |  |