| Param | Original file | Final file |
|---|---|---|
| Filename | modeM0/AS1A12_083T07_9000005440cztM0_level2.fits | modeM0/AS1A12_083T07_9000005440cztM0_level2_quad_clean.evt |
| Size (bytes) | 106,482,240 | 111,600,000 |
| Size | 101.5 MB | 106.4 MB |
| Events in quadrant A | 666,608 | 710,277 |
| Events in quadrant B | 640,734 | 703,308 |
| Events in quadrant C | 606,574 | 637,589 |
| Events in quadrant D | 444,616 | 464,588 |
| Mode M0 | |||
|---|---|---|---|
| Quadrant | BADHDUFLAG | Total packets | Discarded packets |
| A | 0 | 30407 | 0 |
| B | 0 | 25985 | 0 |
| C | 0 | 39581 | 0 |
| D | 0 | 75433 | 0 |
| Mode M9 | |||
|---|---|---|---|
| Quadrant | BADHDUFLAG | Total packets | Discarded packets |
| A | 0 | 42 | 0 |
| B | 0 | 42 | 0 |
| C | 0 | 42 | 0 |
| D | 0 | 42 | 0 |
| Mode SS | |||
|---|---|---|---|
| Quadrant | BADHDUFLAG | Total packets | Discarded packets |
| A | 0 | 256 | 0 |
| B | 0 | 256 | 0 |
| C | 0 | 256 | 0 |
| D | 0 | 256 | 0 |
| Quadrant | Total seconds | Saturated seconds | Saturation percentage |
|---|---|---|---|
| A | 12484 | 96 | 0.768984% |
| B | 12484 | 73 | 0.584748% |
| C | 12484 | 1450 | 11.614867% |
| D | 12484 | 5417 | 43.391541% |
Noise dominated data is calculated using 1-second bins in cleaned event files. If a bin has >2000 counts, and if more than 50% of those come from <1% of pixels, then it is considered to be noise-dominated and hence unusable.
| Quadrant | # 1 sec bins | Bins with >0 counts | Bins with >2000 counts | High rate bins dominated by noise | Noise dominated (total time) | Noise dominated (detector-on time) | Marked lightcurve |
|---|---|---|---|---|---|---|---|
| A | 16663 | 12484 | 0 | 0 | 0.00% | 0.00% | 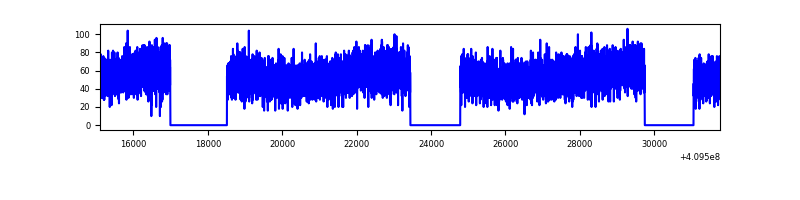 |
| B | 16663 | 12481 | 0 | 0 | 0.00% | 0.00% |  |
| C | 16663 | 12475 | 0 | 0 | 0.00% | 0.00% |  |
| D | 16663 | 12378 | 0 | 0 | 0.00% | 0.00% | 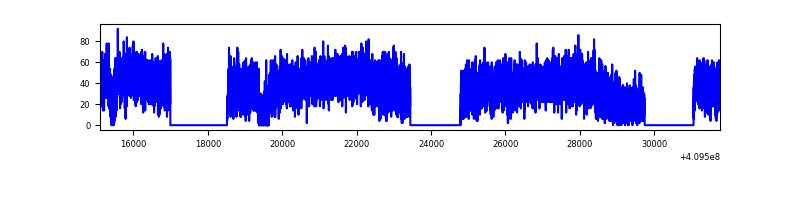 |
Top three noisy pixels from each quadrant. If the there are fewer than three noisy pixels in the level2.evt file, extra rows are filled as -1
| Pixel properties | Quadrant properties | ||||||
|---|---|---|---|---|---|---|---|
| Quadrant | DetID | PixID | Counts | Sigma | Mean | Median | Sigma |
| A | 9 | 19 | 569 | 8.77 | 174 | 163 | 46.3 |
| A | 7 | 110 | 551 | 8.38 | 174 | 163 | 46.3 |
| A | 0 | 29 | 520 | 7.71 | 174 | 163 | 46.3 |
| B | 2 | 9 | 541 | 10.48 | 169 | 162 | 36.2 |
| B | 3 | 80 | 509 | 9.6 | 169 | 162 | 36.2 |
| B | 2 | 8 | 474 | 8.63 | 169 | 162 | 36.2 |
| C | 1 | 81 | 507 | 8.22 | 160 | 150 | 43.4 |
| C | 1 | 80 | 492 | 7.88 | 160 | 150 | 43.4 |
| C | 1 | 65 | 449 | 6.89 | 160 | 150 | 43.4 |
| D | 4 | 160 | 371 | 7.11 | 127 | 116 | 35.9 |
| D | 7 | 3 | 368 | 7.02 | 127 | 116 | 35.9 |
| D | 3 | 14 | 339 | 6.22 | 127 | 116 | 35.9 |
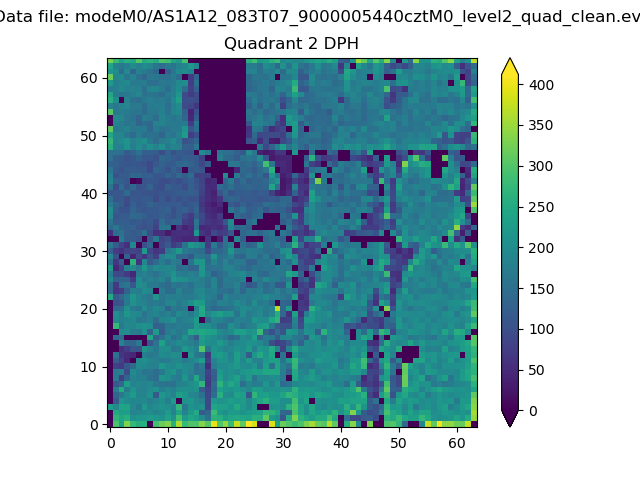
Histogram calculated using DETX and DETY for each event in the final _common_clean file
| Quadrant A | 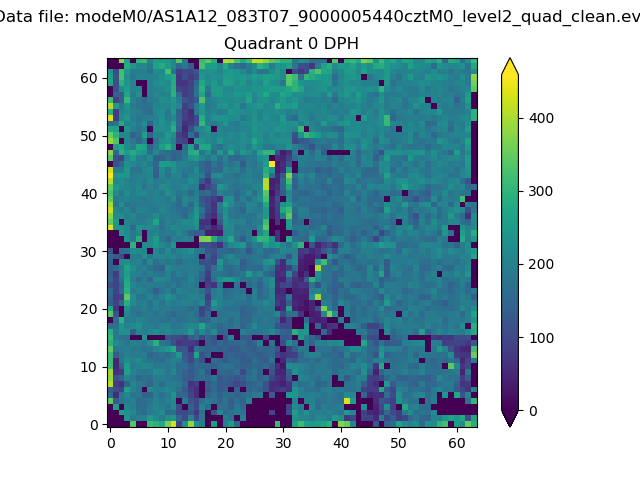 |
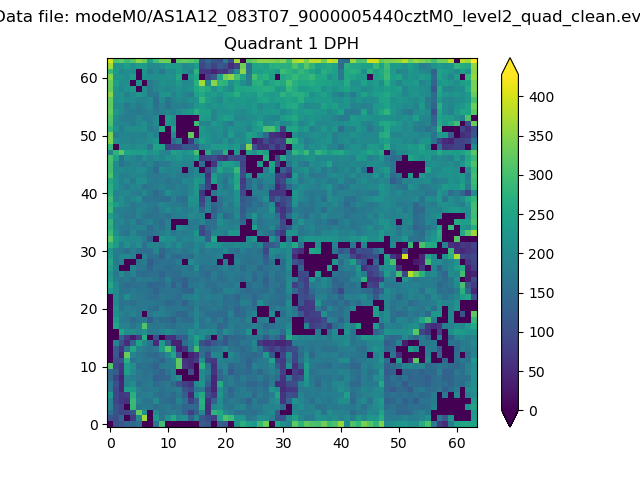 |
Quadrant B |
|---|---|---|---|
| Quadrant D | 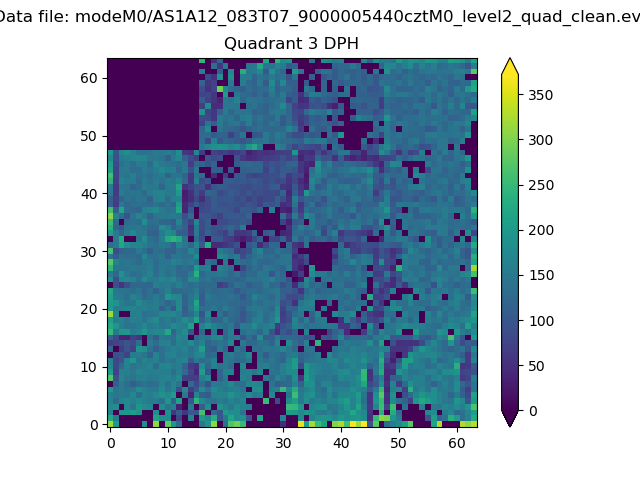 |
 |
Quadrant C |
| Plot type | Count rate plots | Images |
|---|---|---|
| Comparison with Poisson distribution Blue bars denote a histogram of data divided into 1 sec bins. Red curve is a Poisson curve with rate = median count rate of data. |
 |
 |
| Quadrant-wise count rates Data is divided into 100 sec bins |
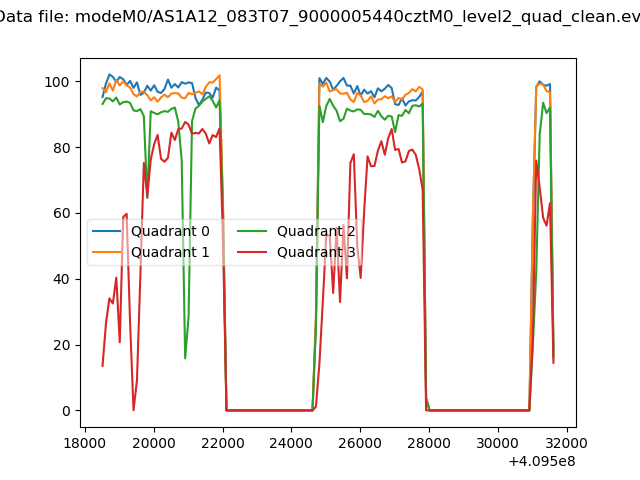 |
|
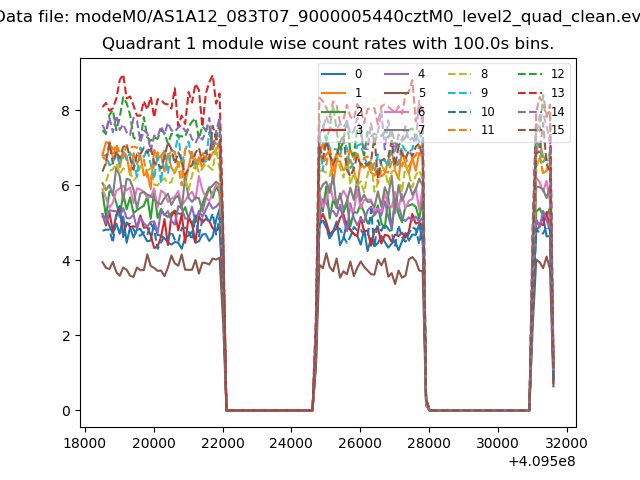
| Module-wise count rates for Quadrant A Data is divided into 100 sec bins |
 |
 |
| Module-wise count rates for Quadrant B Data is divided into 100 sec bins |
 |
 |
| Module-wise count rates for Quadrant C Data is divided into 100 sec bins |
 |
 |
| Module-wise count rates for Quadrant D Data is divided into 100 sec bins |
 |
 |
| Parameter | Plot |
|---|---|
| CZT HV Monitor |  |
| D_VDD | 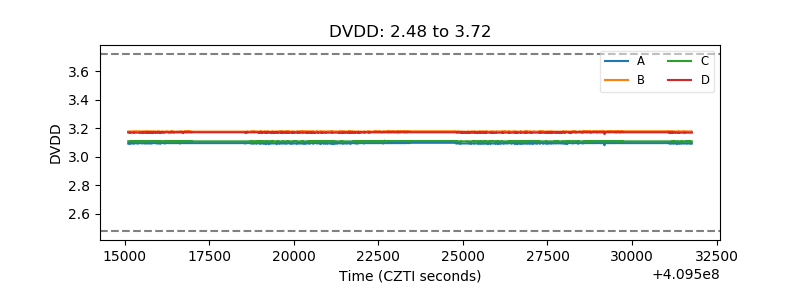 |
| Temperature 1 | 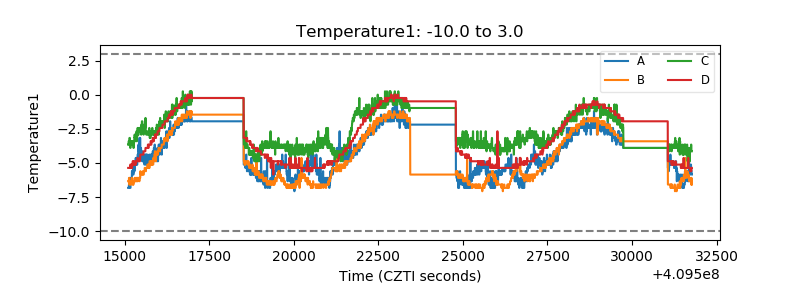 |
| Veto HV Monitor |  |
| Veto LLD | 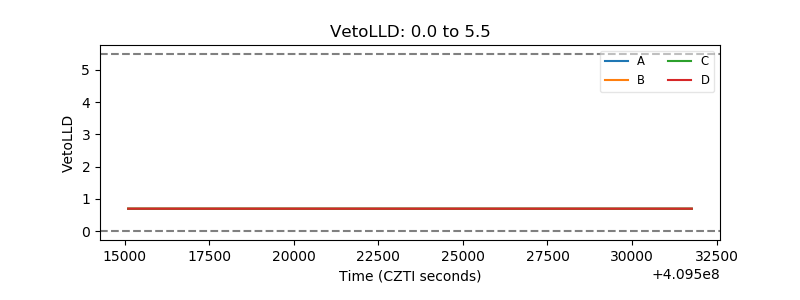 |
| Alpha Counter | 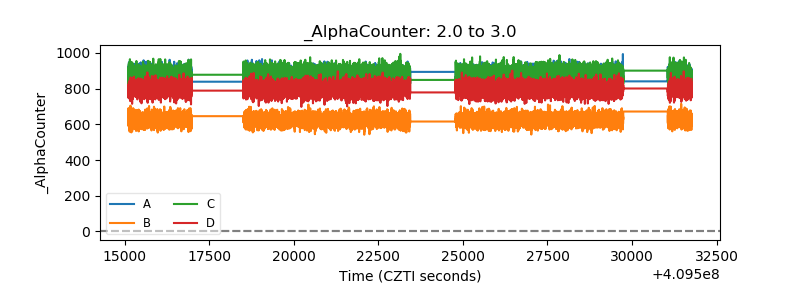 |
| _CPM_Rate |  |
| CZT Counter | 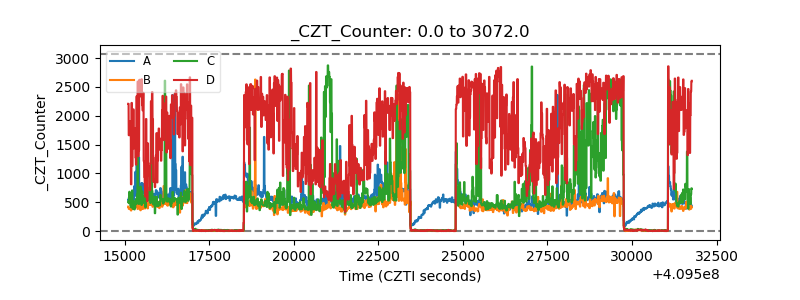 |
| +2.5 Volts monitor |  |
| +5 Volts monitor |  |
| _ROLL_ROT | 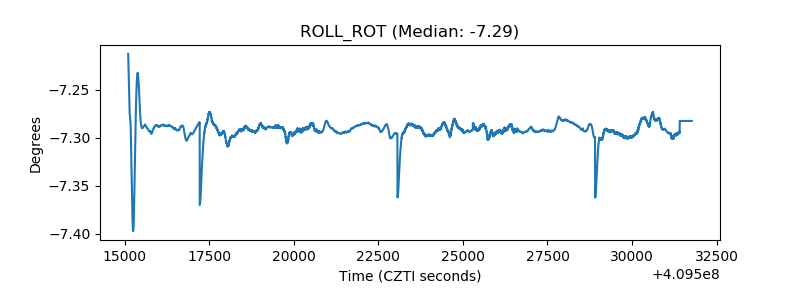 |
| _Roll_DEC | 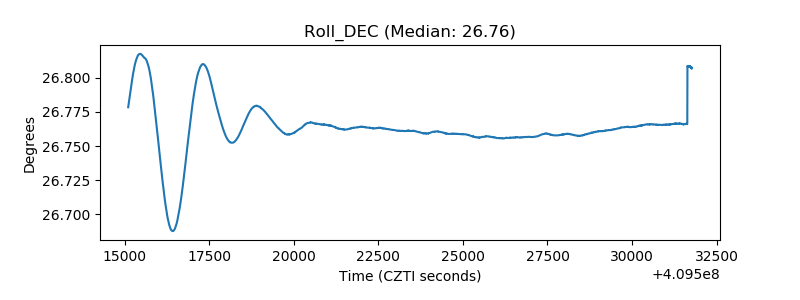 |
| _Roll_RA | 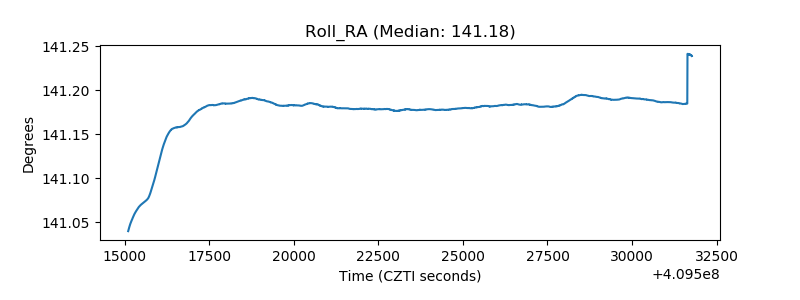 |
| Veto Counter | 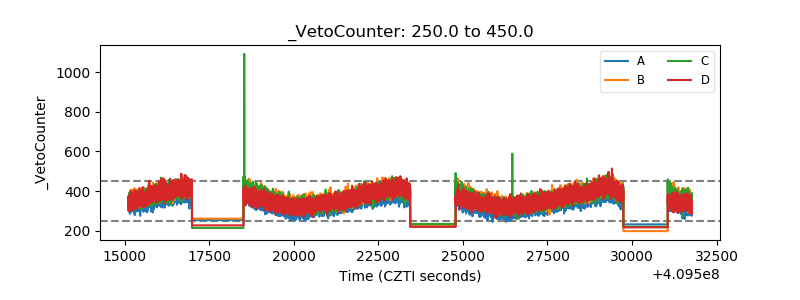 |