| Param | Original file | Final file |
|---|---|---|
| Filename | modeM0/AS1A12_054T04_9000005446cztM0_level2.fits | modeM0/AS1A12_054T04_9000005446cztM0_level2_quad_clean.evt |
| Size (bytes) | 1,109,632,320 | 1,201,167,360 |
| Size | 1.0 GB | 1.1 GB |
| Events in quadrant A | 7,181,918 | 8,348,675 |
| Events in quadrant B | 6,815,398 | 8,234,533 |
| Events in quadrant C | 6,955,466 | 7,855,019 |
| Events in quadrant D | 3,660,226 | 2,987,697 |
| Mode M9 | |||
|---|---|---|---|
| Quadrant | BADHDUFLAG | Total packets | Discarded packets |
| A | 0 | 506 | 0 |
| B | 0 | 505 | 0 |
| C | 0 | 505 | 0 |
| D | 0 | 508 | 0 |
| Mode M0 | |||
|---|---|---|---|
| Quadrant | BADHDUFLAG | Total packets | Discarded packets |
| A | 0 | 291235 | 0 |
| B | 0 | 282993 | 0 |
| C | 0 | 267805 | 0 |
| D | 0 | 903996 | 0 |
| Mode SS | |||
|---|---|---|---|
| Quadrant | BADHDUFLAG | Total packets | Discarded packets |
| A | 0 | 2660 | 0 |
| B | 0 | 2660 | 0 |
| C | 0 | 2660 | 0 |
| D | 0 | 2660 | 0 |
| Quadrant | Total seconds | Saturated seconds | Saturation percentage |
|---|---|---|---|
| A | 130642 | 1508 | 1.154300% |
| B | 130642 | 1777 | 1.360206% |
| C | 130641 | 142 | 0.108695% |
| D | 130642 | 87051 | 66.633242% |
Noise dominated data is calculated using 1-second bins in cleaned event files. If a bin has >2000 counts, and if more than 50% of those come from <1% of pixels, then it is considered to be noise-dominated and hence unusable.
| Quadrant | # 1 sec bins | Bins with >0 counts | Bins with >2000 counts | High rate bins dominated by noise | Noise dominated (total time) | Noise dominated (detector-on time) | Marked lightcurve |
|---|---|---|---|---|---|---|---|
| A | 189413 | 130633 | 0 | 0 | 0.00% | 0.00% |  |
| B | 189413 | 130613 | 0 | 0 | 0.00% | 0.00% | 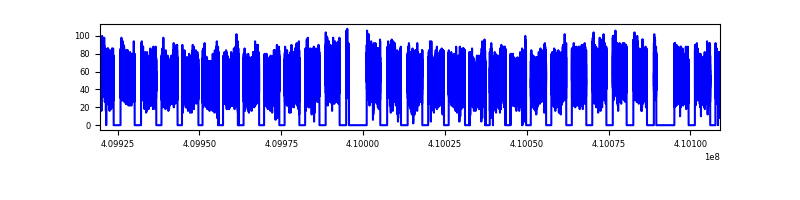 |
| C | 189413 | 130644 | 0 | 0 | 0.00% | 0.00% |  |
| D | 189413 | 128853 | 0 | 0 | 0.00% | 0.00% |  |
Top three noisy pixels from each quadrant. If the there are fewer than three noisy pixels in the level2.evt file, extra rows are filled as -1
| Pixel properties | Quadrant properties | ||||||
|---|---|---|---|---|---|---|---|
| Quadrant | DetID | PixID | Counts | Sigma | Mean | Median | Sigma |
| A | 7 | 110 | 5995 | 9.05 | 1875 | 1766 | 467.0 |
| A | 9 | 19 | 5899 | 8.85 | 1875 | 1766 | 467.0 |
| A | 0 | 29 | 5773 | 8.58 | 1875 | 1766 | 467.0 |
| B | 2 | 9 | 5822 | 11.82 | 1803 | 1727 | 346.5 |
| B | 3 | 80 | 5359 | 10.48 | 1803 | 1727 | 346.5 |
| B | 5 | 128 | 4678 | 8.52 | 1803 | 1727 | 346.5 |
| C | 1 | 81 | 5890 | 8.91 | 1839 | 1725 | 467.6 |
| C | 1 | 80 | 5661 | 8.42 | 1839 | 1725 | 467.6 |
| C | 3 | 202 | 5566 | 8.21 | 1839 | 1725 | 467.6 |
| D | 7 | 3 | 2755 | 6.41 | 1048 | 957 | 280.4 |
| D | 10 | 113 | 2695 | 6.2 | 1048 | 957 | 280.4 |
| D | 4 | 160 | 2675 | 6.13 | 1048 | 957 | 280.4 |
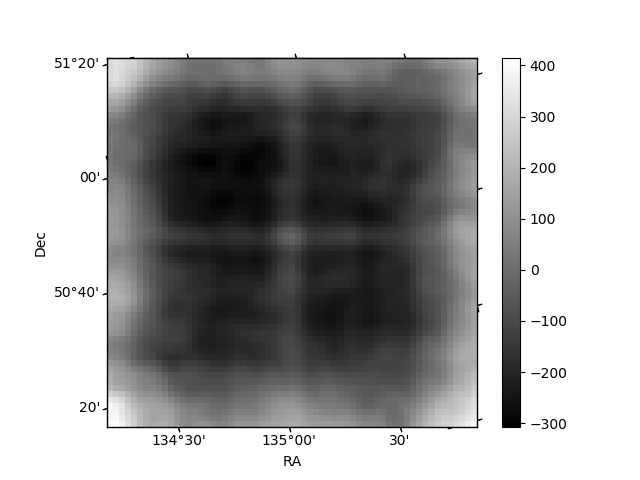
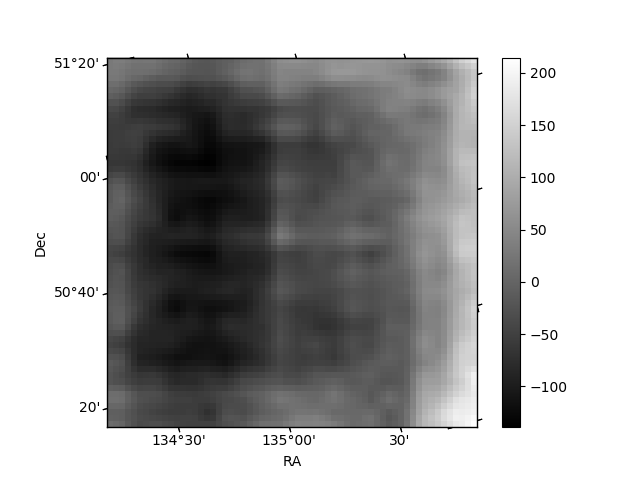
Histogram calculated using DETX and DETY for each event in the final _common_clean file
| Quadrant A |  |
 |
Quadrant B |
|---|---|---|---|
| Quadrant D |  |
 |
Quadrant C |
| Plot type | Count rate plots | Images |
|---|---|---|
| Comparison with Poisson distribution Blue bars denote a histogram of data divided into 1 sec bins. Red curve is a Poisson curve with rate = median count rate of data. |
 |
 |
| Quadrant-wise count rates Data is divided into 100 sec bins |
 |
|
| Module-wise count rates for Quadrant A Data is divided into 100 sec bins |
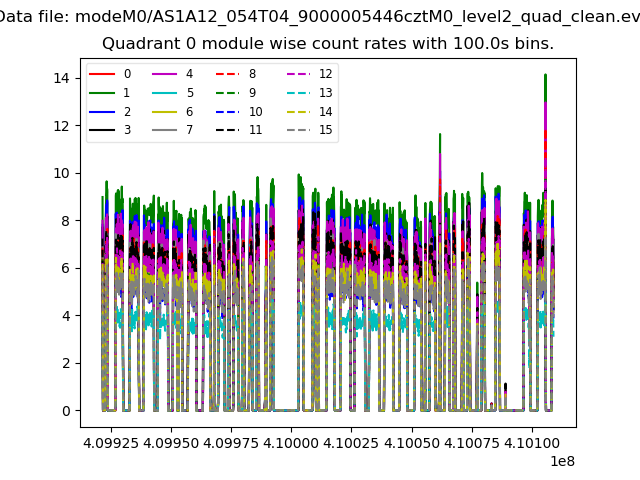 |
 |
| Module-wise count rates for Quadrant B Data is divided into 100 sec bins |
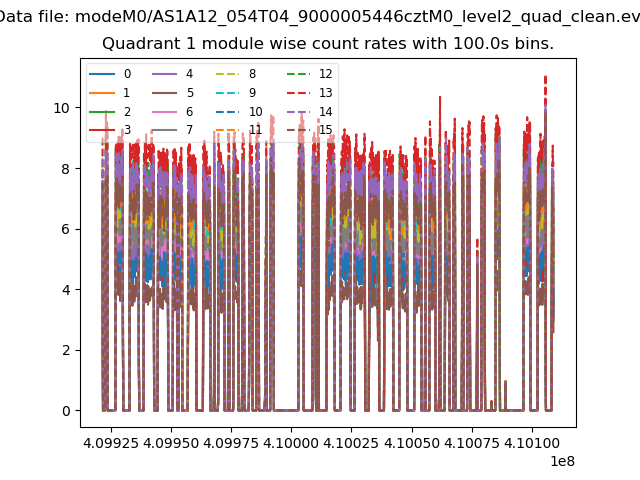 |
 |
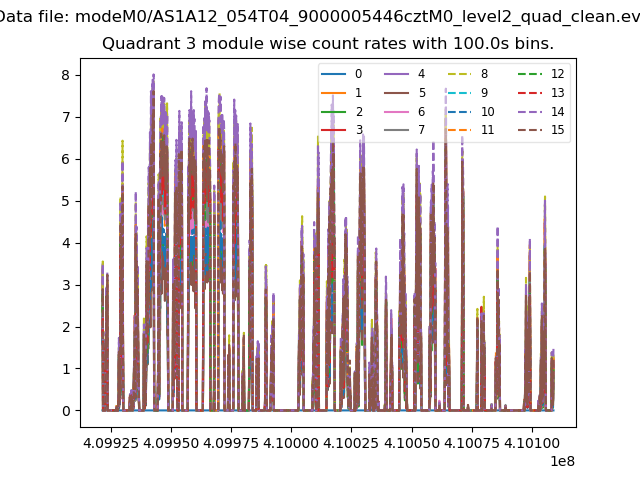
| Module-wise count rates for Quadrant C Data is divided into 100 sec bins |
 |
 |
| Module-wise count rates for Quadrant D Data is divided into 100 sec bins |
 |
 |
| Parameter | Plot |
|---|---|
| CZT HV Monitor |  |
| D_VDD |  |
| Temperature 1 |  |
| Veto HV Monitor |  |
| Veto LLD | 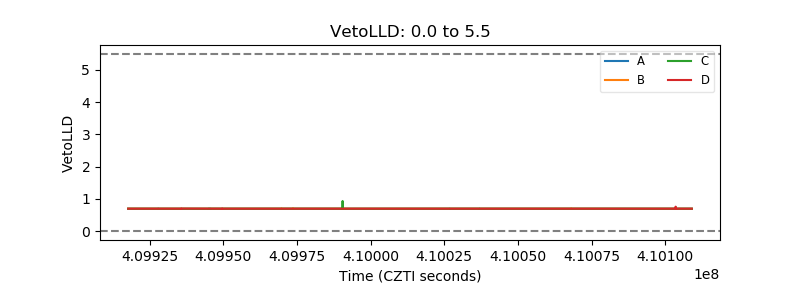 |
| Alpha Counter |  |
| _CPM_Rate |  |
| CZT Counter | 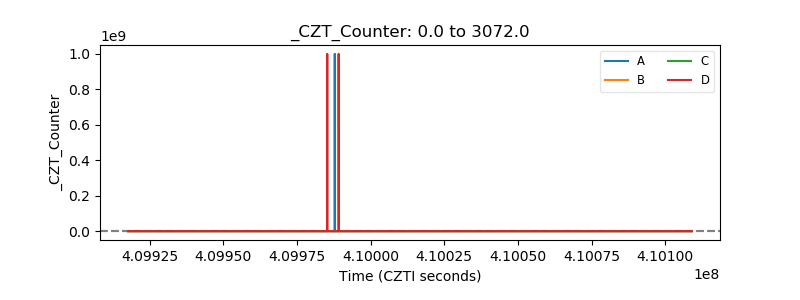 |
| +2.5 Volts monitor |  |
| +5 Volts monitor |  |
| _ROLL_ROT |  |
| _Roll_DEC | 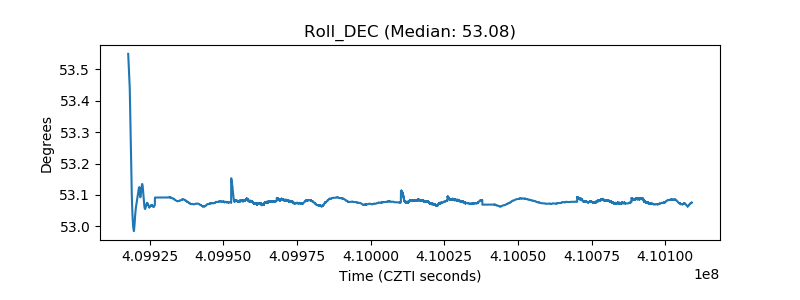 |
| _Roll_RA |  |
| Veto Counter |  |