| Param | Original file | Final file |
|---|---|---|
| Filename | modeM0/AS1A12_095T01_9000005450cztM0_level2.fits | modeM0/AS1A12_095T01_9000005450cztM0_level2_quad_clean.evt |
| Size (bytes) | 252,555,840 | 192,458,880 |
| Size | 240.9 MB | 183.5 MB |
| Events in quadrant A | 1,623,688 | 1,091,556 |
| Events in quadrant B | 1,509,104 | 1,091,007 |
| Events in quadrant C | 1,564,818 | 1,042,262 |
| Events in quadrant D | 1,029,056 | 686,172 |
| Mode M9 | |||
|---|---|---|---|
| Quadrant | BADHDUFLAG | Total packets | Discarded packets |
| A | 0 | 119 | 0 |
| B | 0 | 119 | 0 |
| C | 0 | 119 | 0 |
| D | 0 | 119 | 0 |
| Mode M0 | |||
|---|---|---|---|
| Quadrant | BADHDUFLAG | Total packets | Discarded packets |
| A | 0 | 64261 | 0 |
| B | 0 | 67356 | 0 |
| C | 0 | 56823 | 0 |
| D | 0 | 171706 | 0 |
| Mode SS | |||
|---|---|---|---|
| Quadrant | BADHDUFLAG | Total packets | Discarded packets |
| A | 0 | 570 | 0 |
| B | 0 | 570 | 0 |
| C | 0 | 570 | 0 |
| D | 0 | 570 | 0 |
| Quadrant | Total seconds | Saturated seconds | Saturation percentage |
|---|---|---|---|
| A | 27854 | 457 | 1.640698% |
| B | 27854 | 1111 | 3.988655% |
| C | 27854 | 23 | 0.082573% |
| D | 27854 | 13605 | 48.843972% |
Noise dominated data is calculated using 1-second bins in cleaned event files. If a bin has >2000 counts, and if more than 50% of those come from <1% of pixels, then it is considered to be noise-dominated and hence unusable.
| Quadrant | # 1 sec bins | Bins with >0 counts | Bins with >2000 counts | High rate bins dominated by noise | Noise dominated (total time) | Noise dominated (detector-on time) | Marked lightcurve |
|---|---|---|---|---|---|---|---|
| A | 51405 | 27853 | 0 | 0 | 0.00% | 0.00% |  |
| B | 51405 | 27826 | 0 | 0 | 0.00% | 0.00% |  |
| C | 51405 | 27854 | 0 | 0 | 0.00% | 0.00% | 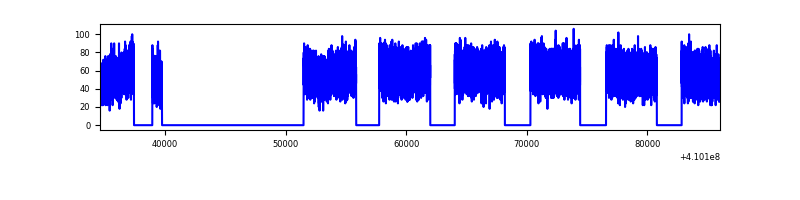 |
| D | 51405 | 27816 | 0 | 0 | 0.00% | 0.00% |  |
Top three noisy pixels from each quadrant. If the there are fewer than three noisy pixels in the level2.evt file, extra rows are filled as -1
| Pixel properties | Quadrant properties | ||||||
|---|---|---|---|---|---|---|---|
| Quadrant | DetID | PixID | Counts | Sigma | Mean | Median | Sigma |
| A | 0 | 29 | 1292 | 8.42 | 424 | 399 | 106.1 |
| A | 9 | 19 | 1275 | 8.26 | 424 | 399 | 106.1 |
| A | 7 | 110 | 1271 | 8.22 | 424 | 399 | 106.1 |
| B | 2 | 9 | 1237 | 10.72 | 400 | 384 | 79.5 |
| B | 3 | 80 | 1174 | 9.93 | 400 | 384 | 79.5 |
| B | 3 | 17 | 1052 | 8.4 | 400 | 384 | 79.5 |
| C | 1 | 81 | 1254 | 8.15 | 414 | 389 | 106.2 |
| C | 1 | 80 | 1229 | 7.91 | 414 | 389 | 106.2 |
| C | 1 | 65 | 1092 | 6.62 | 414 | 389 | 106.2 |
| D | 7 | 3 | 781 | 6.51 | 294 | 270 | 78.5 |
| D | 10 | 189 | 779 | 6.48 | 294 | 270 | 78.5 |
| D | 4 | 160 | 753 | 6.15 | 294 | 270 | 78.5 |
Histogram calculated using DETX and DETY for each event in the final _common_clean file
| Quadrant A | 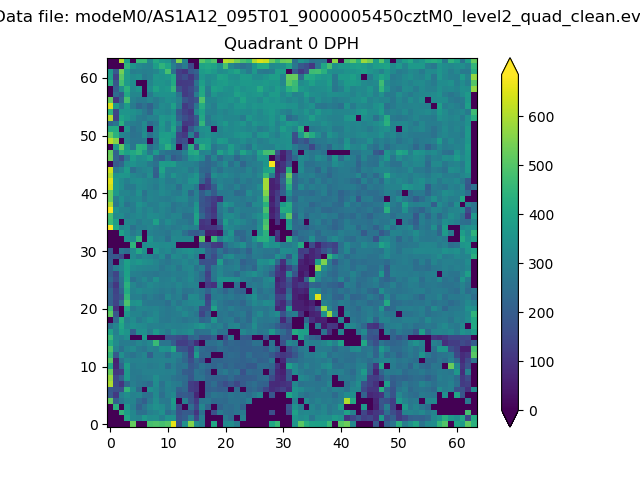 |
 |
Quadrant B |
|---|---|---|---|
| Quadrant D |  |
 |
Quadrant C |
| Plot type | Count rate plots | Images |
|---|---|---|
| Comparison with Poisson distribution Blue bars denote a histogram of data divided into 1 sec bins. Red curve is a Poisson curve with rate = median count rate of data. |
 |
 |
| Quadrant-wise count rates Data is divided into 100 sec bins |
 |
|
| Module-wise count rates for Quadrant A Data is divided into 100 sec bins |
 |
 |
| Module-wise count rates for Quadrant B Data is divided into 100 sec bins |
 |
 |
| Module-wise count rates for Quadrant C Data is divided into 100 sec bins |
 |
 |
| Module-wise count rates for Quadrant D Data is divided into 100 sec bins |
 |
 |
| Parameter | Plot |
|---|---|
| CZT HV Monitor |  |
| D_VDD | 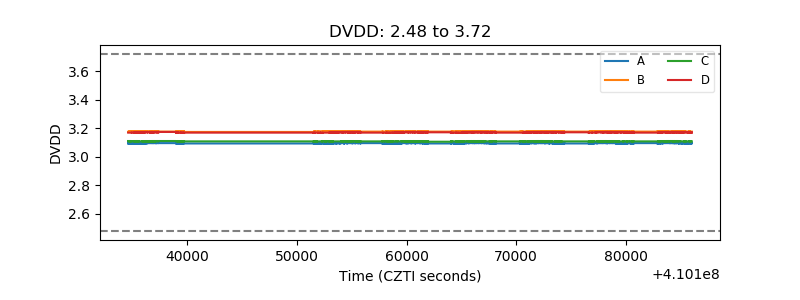 |
| Temperature 1 |  |
| Veto HV Monitor |  |
| Veto LLD |  |
| Alpha Counter |  |
| _CPM_Rate |  |
| CZT Counter |  |
| +2.5 Volts monitor |  |
| +5 Volts monitor |  |
| _ROLL_ROT |  |
| _Roll_DEC |  |
| _Roll_RA |  |
| Veto Counter |  |