| Param | Original file | Final file |
|---|---|---|
| Filename | modeM0/AS1A12_093T02_9000005452cztM0_level2.fits | modeM0/AS1A12_093T02_9000005452cztM0_level2_quad_clean.evt |
| Size (bytes) | 551,376,000 | 532,085,760 |
| Size | 525.8 MB | 507.4 MB |
| Events in quadrant A | 3,473,170 | 3,241,967 |
| Events in quadrant B | 3,274,914 | 3,202,207 |
| Events in quadrant C | 3,402,718 | 3,134,743 |
| Events in quadrant D | 2,239,692 | 2,238,365 |
| Mode M0 | |||
|---|---|---|---|
| Quadrant | BADHDUFLAG | Total packets | Discarded packets |
| A | 0 | 136530 | 0 |
| B | 0 | 149421 | 0 |
| C | 0 | 126940 | 0 |
| D | 0 | 346411 | 0 |
| Mode SS | |||
|---|---|---|---|
| Quadrant | BADHDUFLAG | Total packets | Discarded packets |
| A | 0 | 1272 | 0 |
| B | 0 | 1272 | 0 |
| C | 0 | 1272 | 0 |
| D | 0 | 1272 | 0 |
| Mode M9 | |||
|---|---|---|---|
| Quadrant | BADHDUFLAG | Total packets | Discarded packets |
| A | 0 | 238 | 0 |
| B | 0 | 239 | 0 |
| C | 0 | 239 | 0 |
| D | 0 | 239 | 0 |
| Quadrant | Total seconds | Saturated seconds | Saturation percentage |
|---|---|---|---|
| A | 62647 | 488 | 0.778968% |
| B | 62647 | 1630 | 2.601880% |
| C | 62647 | 53 | 0.084601% |
| D | 62647 | 25745 | 41.095344% |
Noise dominated data is calculated using 1-second bins in cleaned event files. If a bin has >2000 counts, and if more than 50% of those come from <1% of pixels, then it is considered to be noise-dominated and hence unusable.
| Quadrant | # 1 sec bins | Bins with >0 counts | Bins with >2000 counts | High rate bins dominated by noise | Noise dominated (total time) | Noise dominated (detector-on time) | Marked lightcurve |
|---|---|---|---|---|---|---|---|
| A | 87275 | 62647 | 0 | 0 | 0.00% | 0.00% | 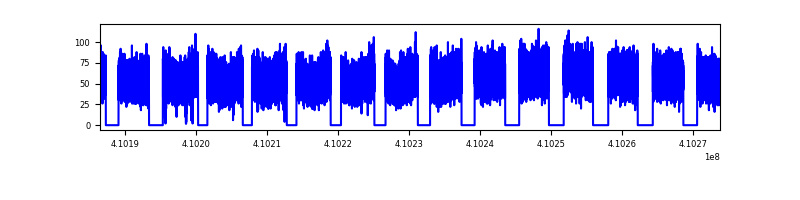 |
| B | 87275 | 62592 | 0 | 0 | 0.00% | 0.00% | 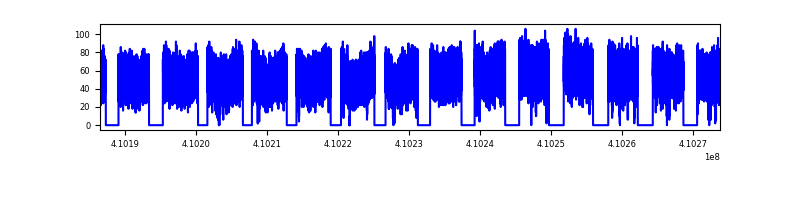 |
| C | 87275 | 62648 | 0 | 0 | 0.00% | 0.00% | 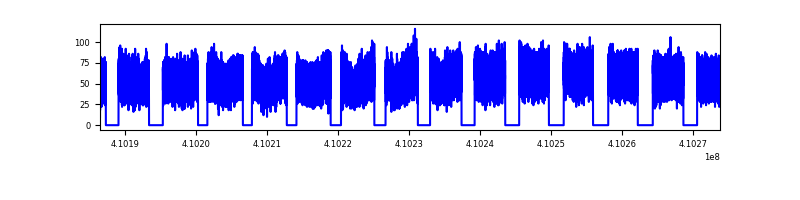 |
| D | 87275 | 62286 | 0 | 0 | 0.00% | 0.00% | 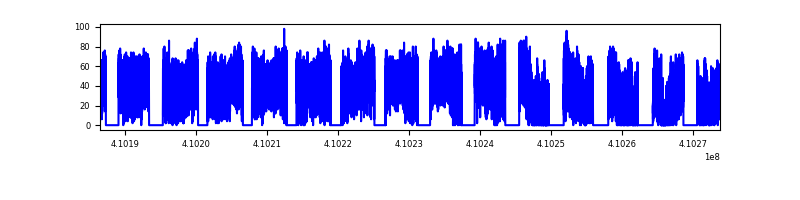 |
Top three noisy pixels from each quadrant. If the there are fewer than three noisy pixels in the level2.evt file, extra rows are filled as -1
| Pixel properties | Quadrant properties | ||||||
|---|---|---|---|---|---|---|---|
| Quadrant | DetID | PixID | Counts | Sigma | Mean | Median | Sigma |
| A | 7 | 110 | 2867 | 8.85 | 905 | 847 | 228.2 |
| A | 0 | 29 | 2827 | 8.68 | 905 | 847 | 228.2 |
| A | 9 | 19 | 2763 | 8.4 | 905 | 847 | 228.2 |
| B | 2 | 9 | 2894 | 12.07 | 865 | 824 | 171.4 |
| B | 3 | 80 | 2467 | 9.58 | 865 | 824 | 171.4 |
| B | 3 | 17 | 2362 | 8.97 | 865 | 824 | 171.4 |
| C | 1 | 81 | 2727 | 8.06 | 900 | 841 | 233.9 |
| C | 3 | 203 | 2706 | 7.97 | 900 | 841 | 233.9 |
| C | 3 | 202 | 2633 | 7.66 | 900 | 841 | 233.9 |
| D | 4 | 160 | 1697 | 6.52 | 638 | 581 | 171.1 |
| D | 10 | 113 | 1673 | 6.38 | 638 | 581 | 171.1 |
| D | 7 | 3 | 1663 | 6.32 | 638 | 581 | 171.1 |
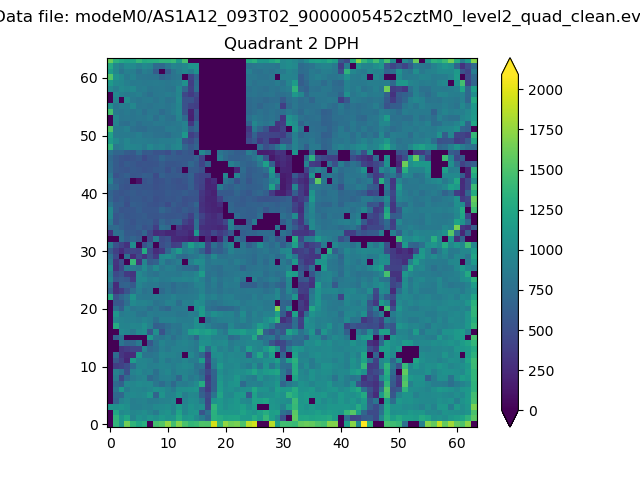
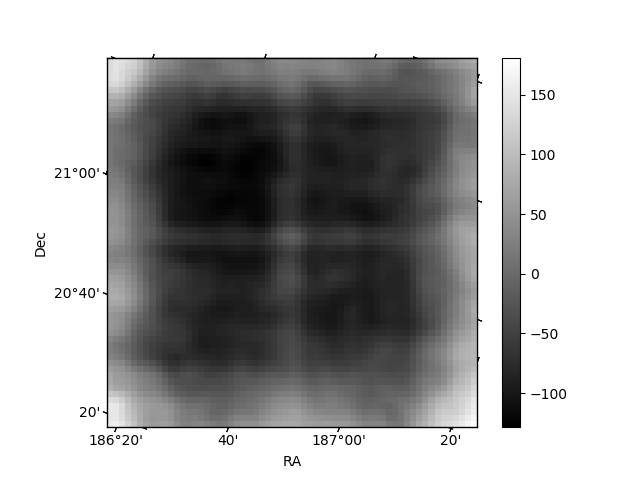
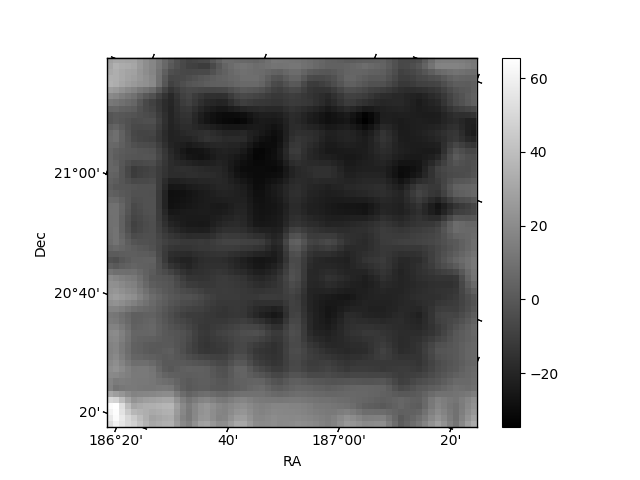
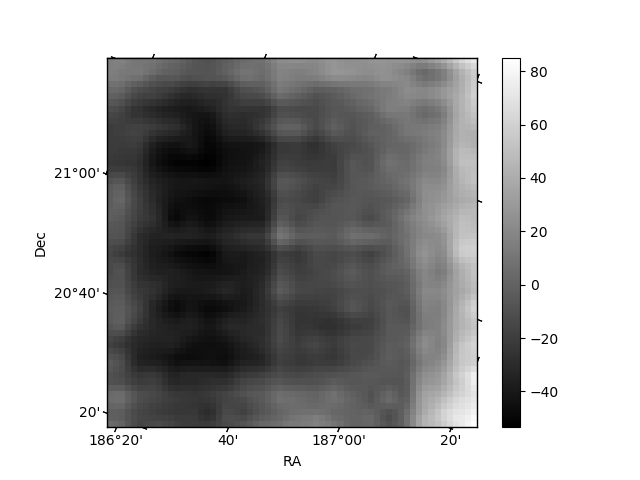
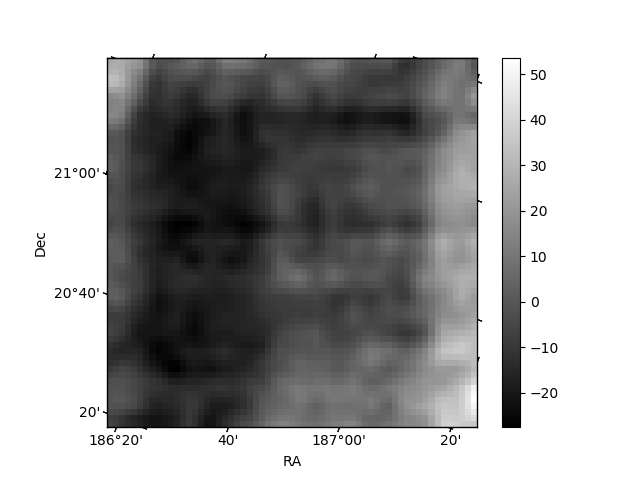
Histogram calculated using DETX and DETY for each event in the final _common_clean file
| Quadrant A | 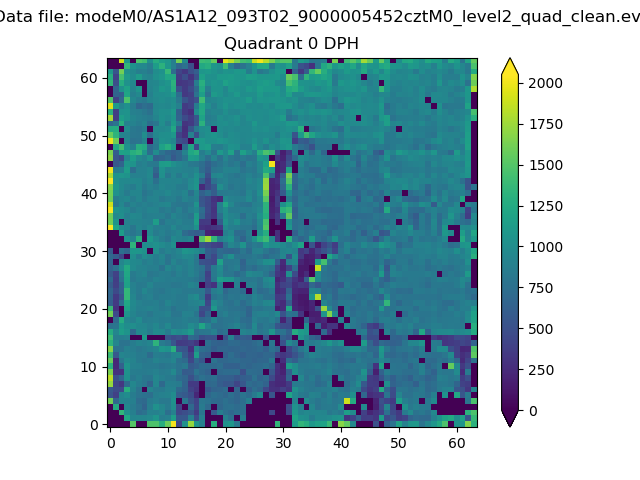 |
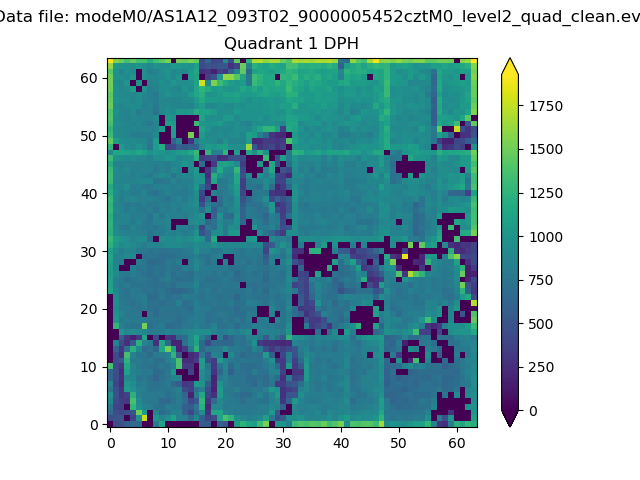 |
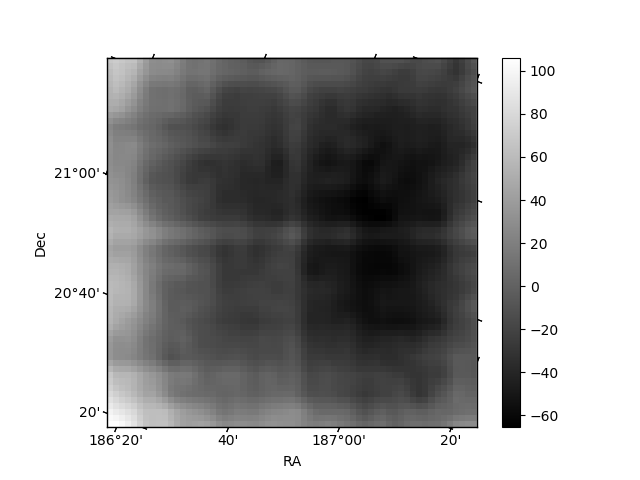
Quadrant B |
|---|---|---|---|
| Quadrant D | 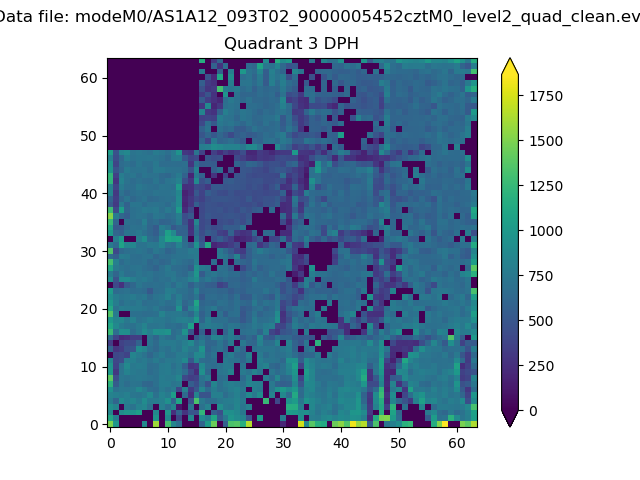 |
 |
Quadrant C |
| Plot type | Count rate plots | Images |
|---|---|---|
| Comparison with Poisson distribution Blue bars denote a histogram of data divided into 1 sec bins. Red curve is a Poisson curve with rate = median count rate of data. |
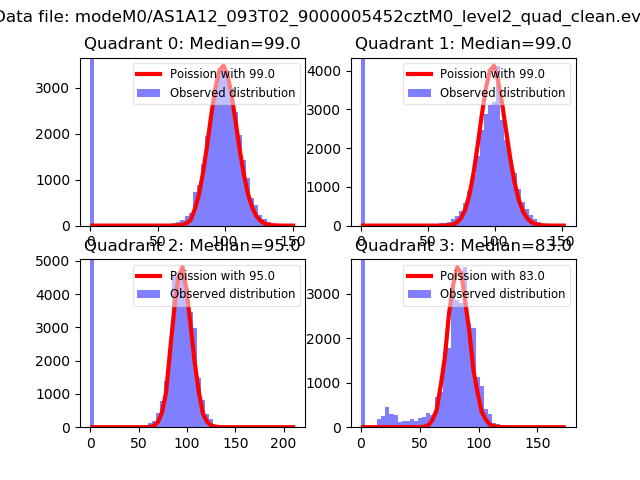 |
 |
| Quadrant-wise count rates Data is divided into 100 sec bins |
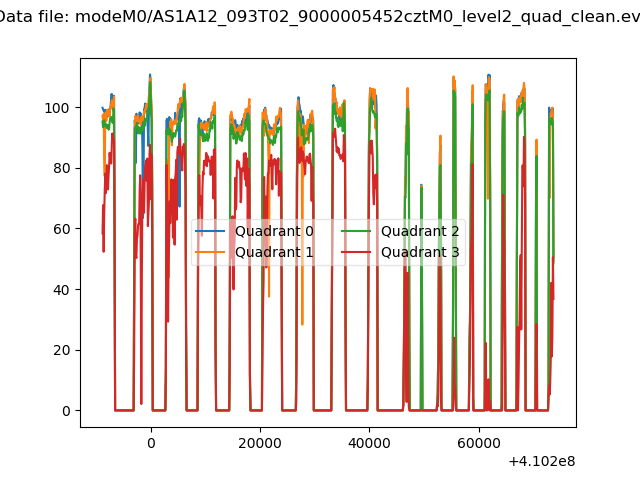 |
|
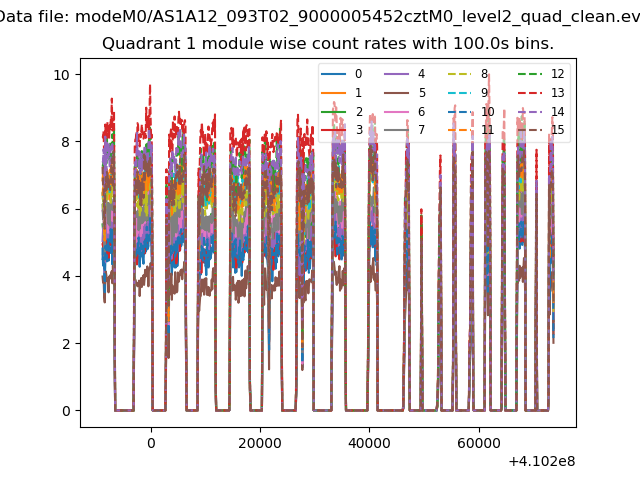
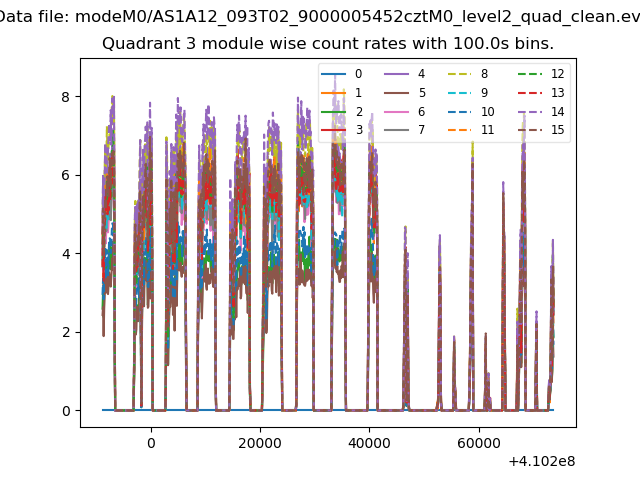
| Module-wise count rates for Quadrant A Data is divided into 100 sec bins |
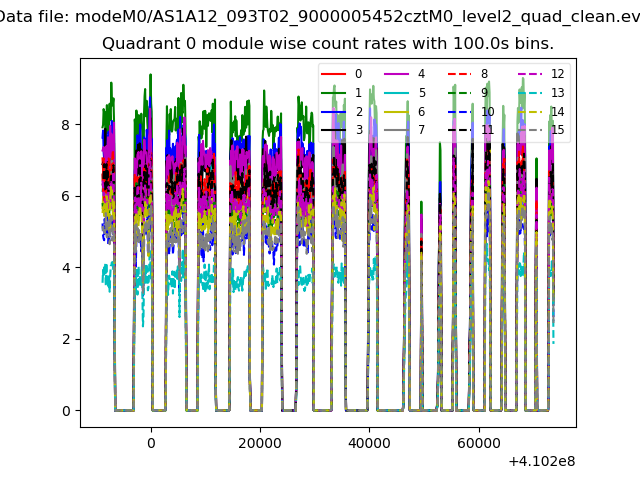 |
 |
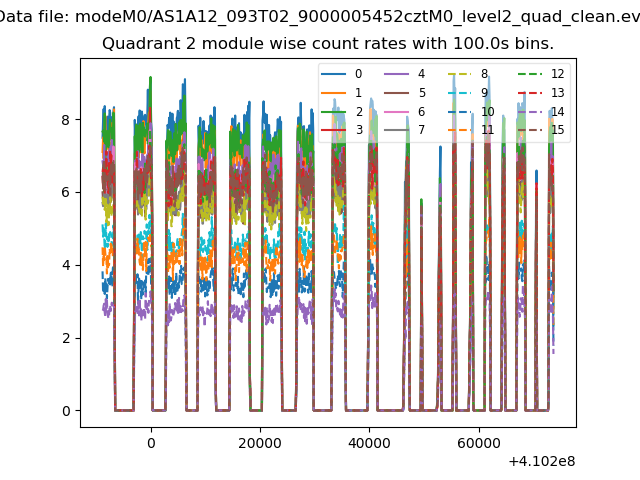
| Module-wise count rates for Quadrant B Data is divided into 100 sec bins |
 |
 |
| Module-wise count rates for Quadrant C Data is divided into 100 sec bins |
 |
 |
| Module-wise count rates for Quadrant D Data is divided into 100 sec bins |
 |
 |
| Parameter | Plot |
|---|---|
| CZT HV Monitor | 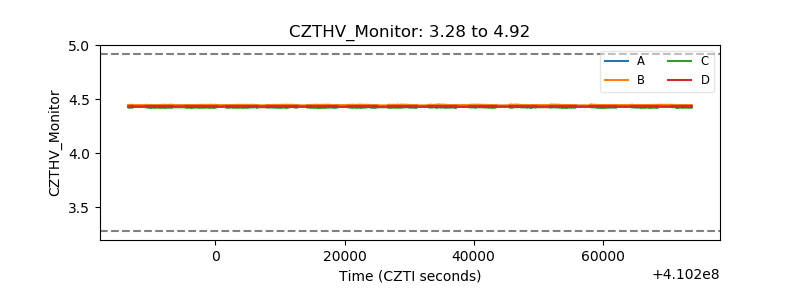 |
| D_VDD | 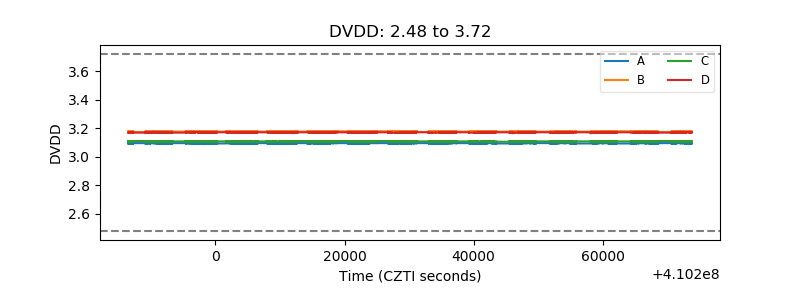 |
| Temperature 1 | 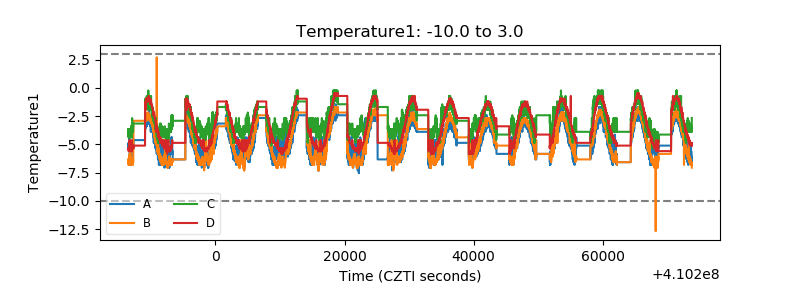 |
| Veto HV Monitor | 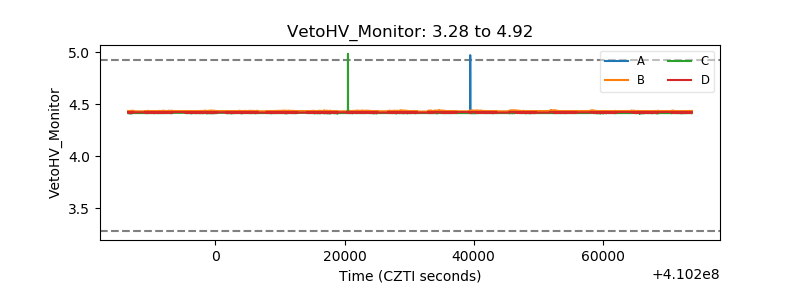 |
| Veto LLD | 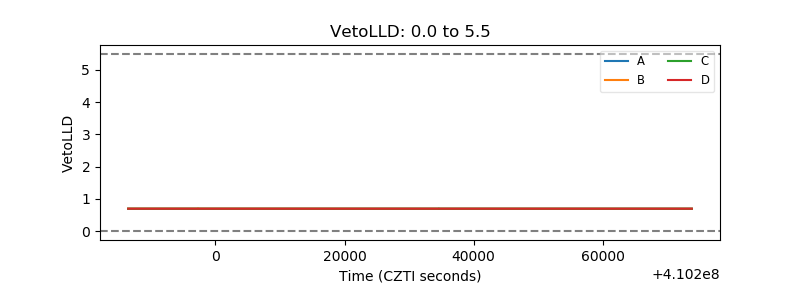 |
| Alpha Counter | 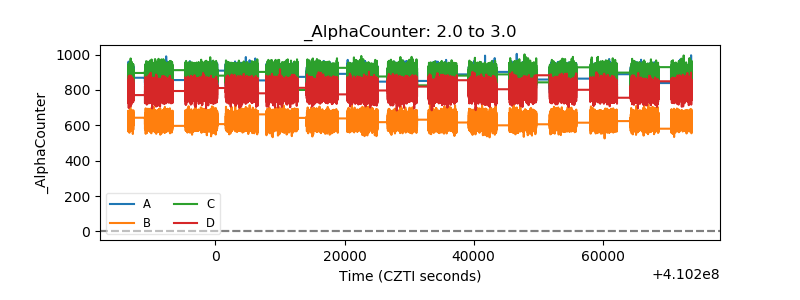 |
| _CPM_Rate | 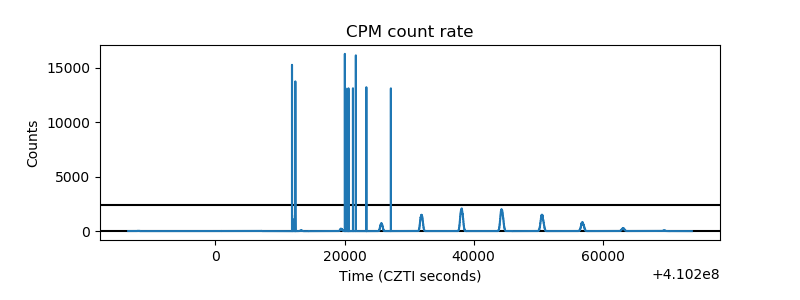 |
| CZT Counter | 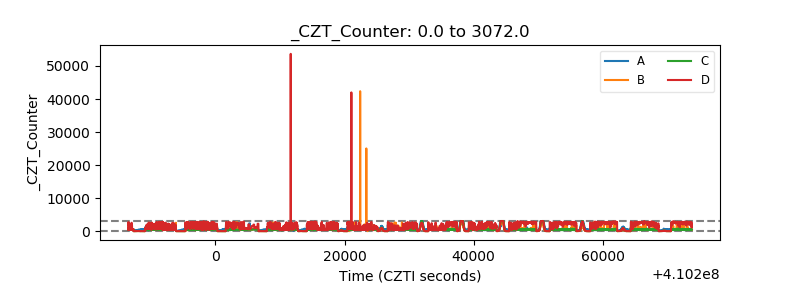 |
| +2.5 Volts monitor | 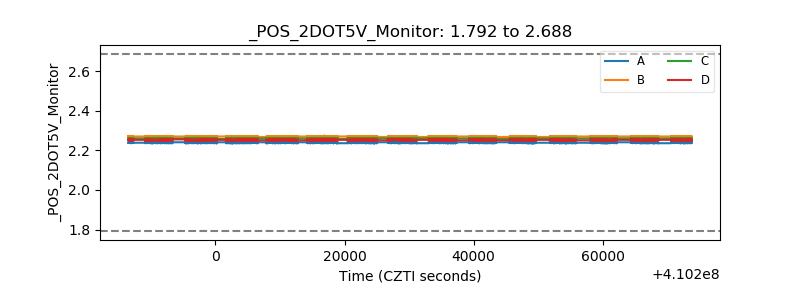 |
| +5 Volts monitor | 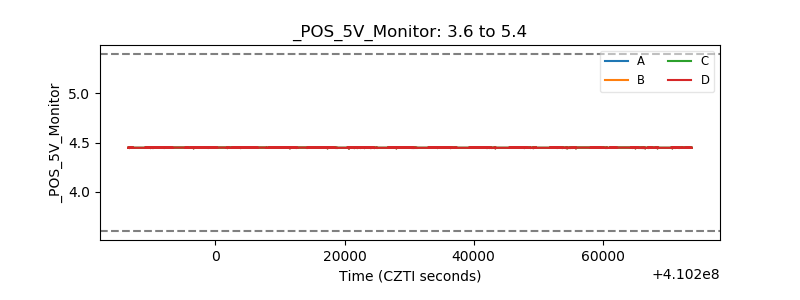 |
| _ROLL_ROT | 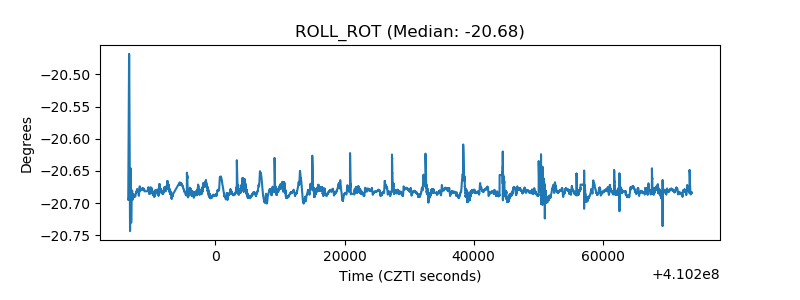 |
| _Roll_DEC | 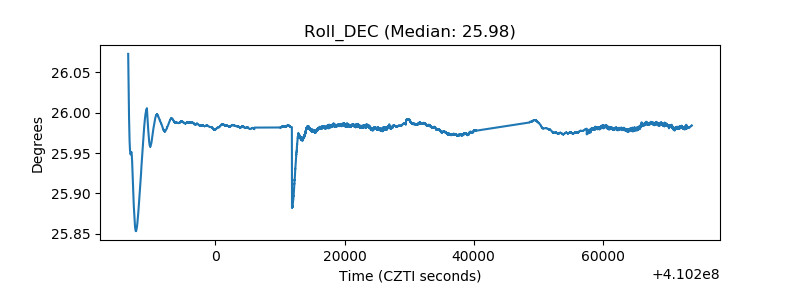 |
| _Roll_RA | 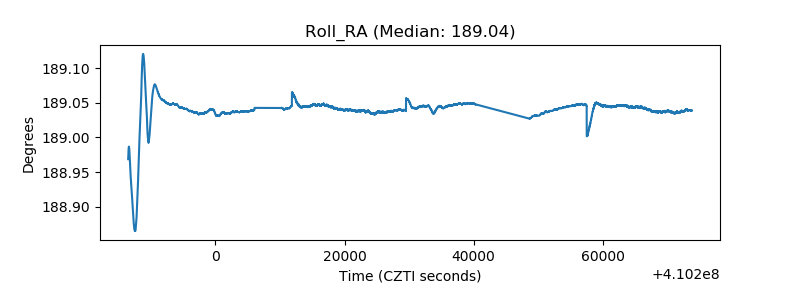 |
| Veto Counter | 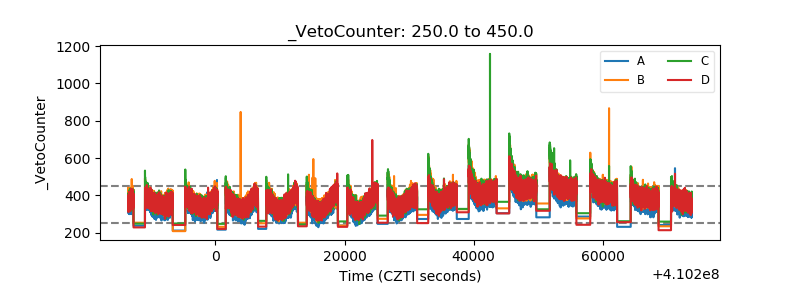 |