| Param | Original file | Final file |
|---|---|---|
| Filename | modeM0/AS1A12_025T12_9000005458cztM0_level2.fits | modeM0/AS1A12_025T12_9000005458cztM0_level2_quad_clean.evt |
| Size (bytes) | 341,015,040 | 268,588,800 |
| Size | 325.2 MB | 256.1 MB |
| Events in quadrant A | 2,188,652 | 1,528,752 |
| Events in quadrant B | 2,091,738 | 1,554,845 |
| Events in quadrant C | 2,138,056 | 1,476,080 |
| Events in quadrant D | 1,307,254 | 978,467 |
| Mode SS | |||
|---|---|---|---|
| Quadrant | BADHDUFLAG | Total packets | Discarded packets |
| A | 0 | 770 | 0 |
| B | 0 | 770 | 0 |
| C | 0 | 770 | 0 |
| D | 0 | 770 | 0 |
| Mode M0 | |||
|---|---|---|---|
| Quadrant | BADHDUFLAG | Total packets | Discarded packets |
| A | 0 | 83269 | 0 |
| B | 0 | 81669 | 0 |
| C | 0 | 79531 | 0 |
| D | 0 | 216687 | 0 |
| Mode M9 | |||
|---|---|---|---|
| Quadrant | BADHDUFLAG | Total packets | Discarded packets |
| A | 0 | 151 | 0 |
| B | 0 | 151 | 0 |
| C | 0 | 151 | 0 |
| D | 0 | 151 | 0 |
| Quadrant | Total seconds | Saturated seconds | Saturation percentage |
|---|---|---|---|
| A | 37779 | 111 | 0.293814% |
| B | 37779 | 439 | 1.162021% |
| C | 37779 | 81 | 0.214405% |
| D | 37779 | 17284 | 45.750285% |
Noise dominated data is calculated using 1-second bins in cleaned event files. If a bin has >2000 counts, and if more than 50% of those come from <1% of pixels, then it is considered to be noise-dominated and hence unusable.
| Quadrant | # 1 sec bins | Bins with >0 counts | Bins with >2000 counts | High rate bins dominated by noise | Noise dominated (total time) | Noise dominated (detector-on time) | Marked lightcurve |
|---|---|---|---|---|---|---|---|
| A | 52780 | 37779 | 0 | 0 | 0.00% | 0.00% | 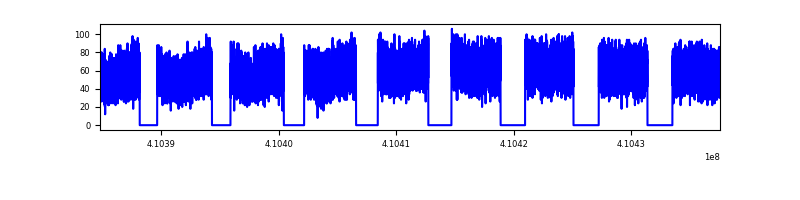 |
| B | 52780 | 37776 | 0 | 0 | 0.00% | 0.00% | 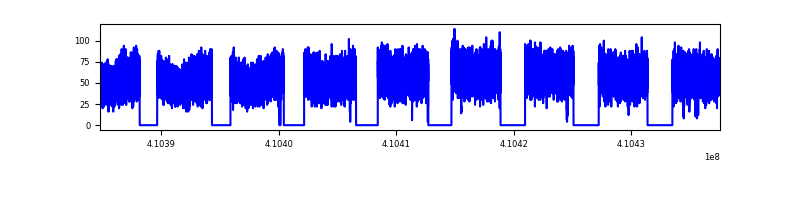 |
| C | 52780 | 37779 | 0 | 0 | 0.00% | 0.00% | 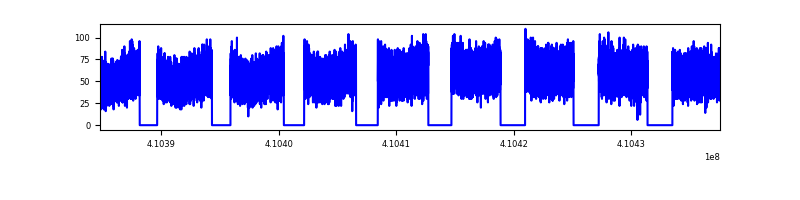 |
| D | 52780 | 37567 | 0 | 0 | 0.00% | 0.00% | 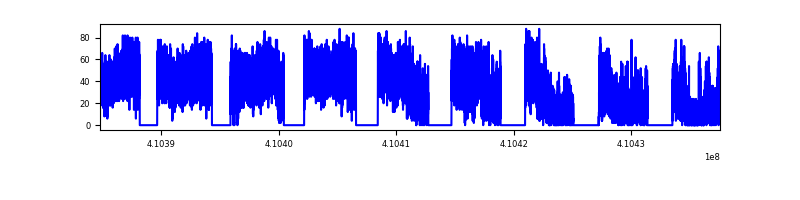 |
Top three noisy pixels from each quadrant. If the there are fewer than three noisy pixels in the level2.evt file, extra rows are filled as -1
| Pixel properties | Quadrant properties | ||||||
|---|---|---|---|---|---|---|---|
| Quadrant | DetID | PixID | Counts | Sigma | Mean | Median | Sigma |
| A | 7 | 110 | 1784 | 8.62 | 570 | 534 | 145.0 |
| A | 0 | 29 | 1744 | 8.35 | 570 | 534 | 145.0 |
| A | 9 | 19 | 1735 | 8.28 | 570 | 534 | 145.0 |
| B | 2 | 9 | 1825 | 11.73 | 553 | 526 | 110.8 |
| B | 3 | 80 | 1617 | 9.85 | 553 | 526 | 110.8 |
| B | 5 | 128 | 1442 | 8.27 | 553 | 526 | 110.8 |
| C | 1 | 81 | 1746 | 8.4 | 565 | 529 | 144.8 |
| C | 1 | 80 | 1684 | 7.98 | 565 | 529 | 144.8 |
| C | 1 | 65 | 1459 | 6.42 | 565 | 529 | 144.8 |
| D | 7 | 3 | 1039 | 6.98 | 373 | 340 | 100.2 |
| D | 10 | 113 | 1002 | 6.61 | 373 | 340 | 100.2 |
| D | 4 | 160 | 984 | 6.43 | 373 | 340 | 100.2 |
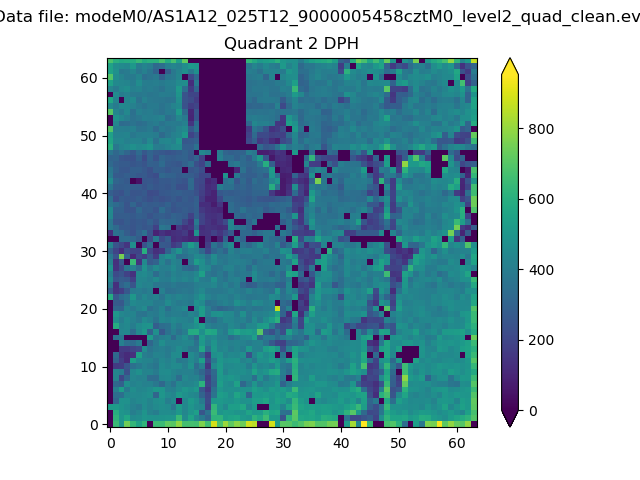
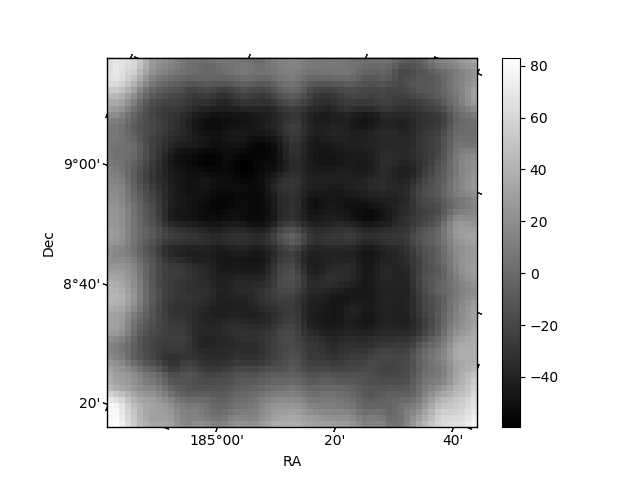
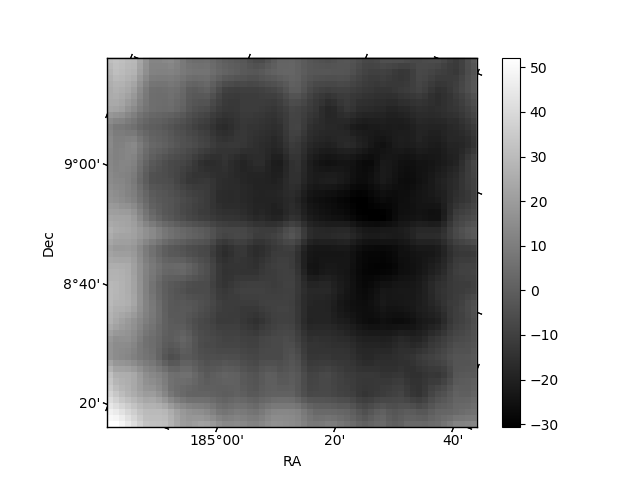
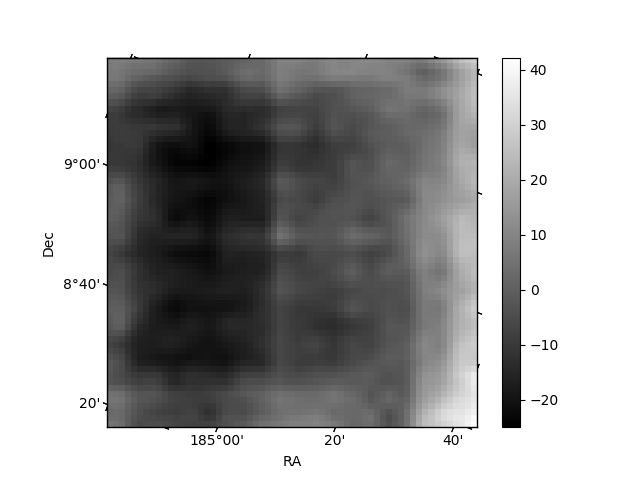
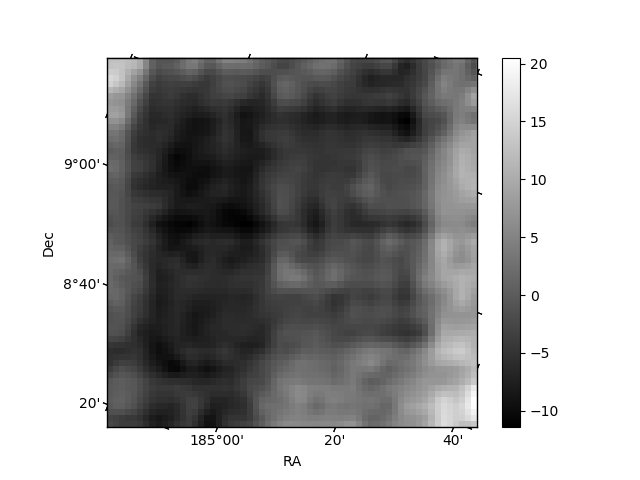
Histogram calculated using DETX and DETY for each event in the final _common_clean file
| Quadrant A | 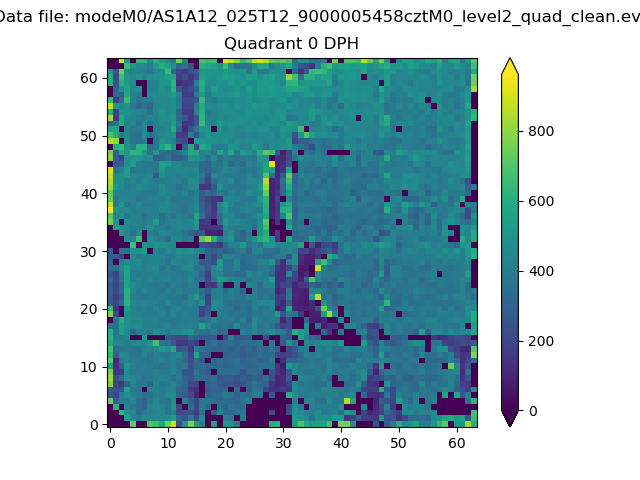 |
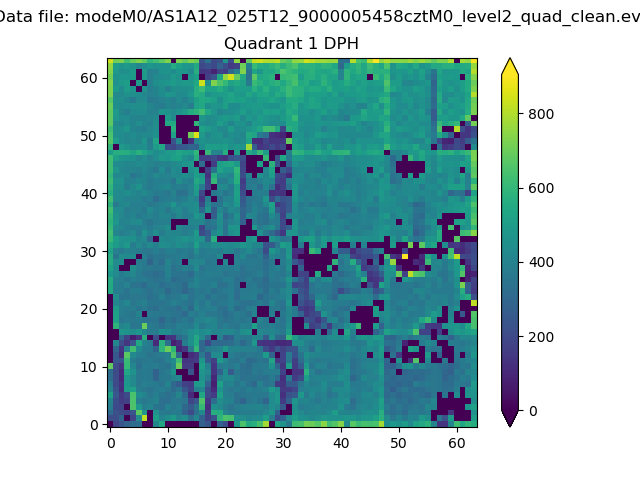 |
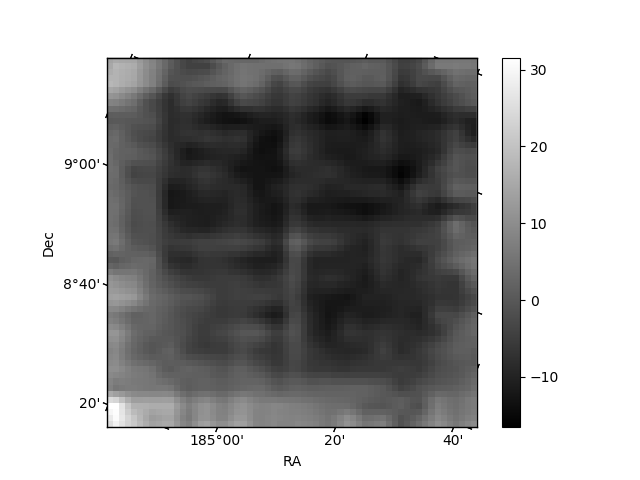
Quadrant B |
|---|---|---|---|
| Quadrant D | 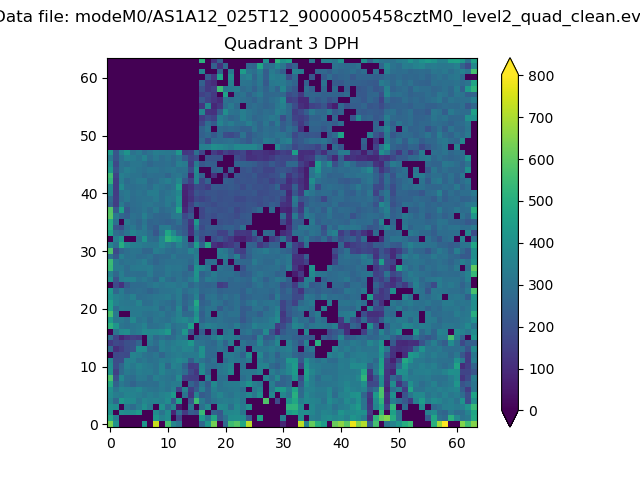 |
 |
Quadrant C |
| Plot type | Count rate plots | Images |
|---|---|---|
| Comparison with Poisson distribution Blue bars denote a histogram of data divided into 1 sec bins. Red curve is a Poisson curve with rate = median count rate of data. |
 |
 |
| Quadrant-wise count rates Data is divided into 100 sec bins |
 |
|
| Module-wise count rates for Quadrant A Data is divided into 100 sec bins |
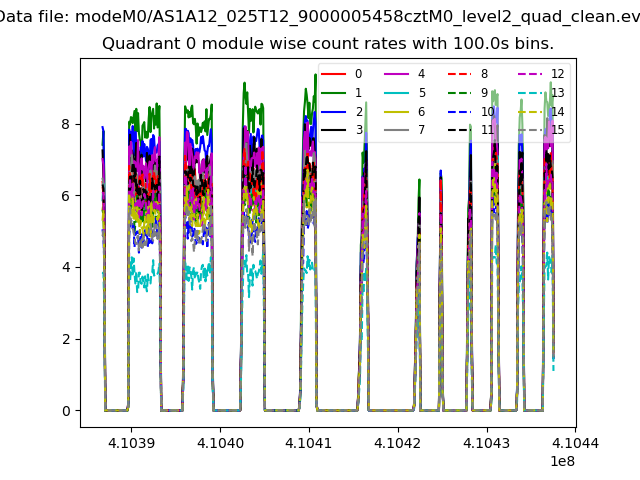 |
 |
| Module-wise count rates for Quadrant B Data is divided into 100 sec bins |
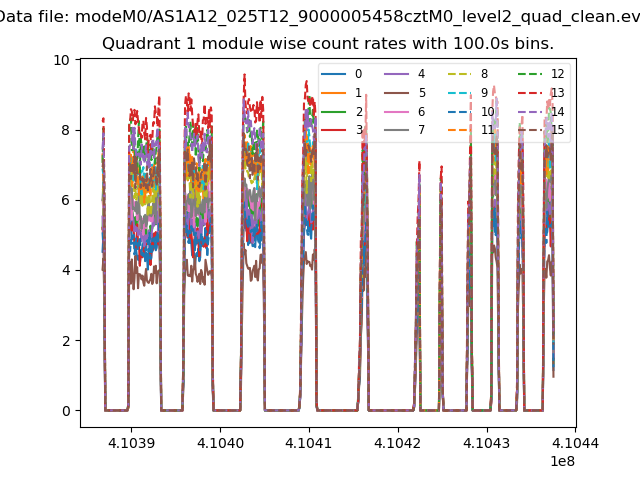 |
 |
| Module-wise count rates for Quadrant C Data is divided into 100 sec bins |
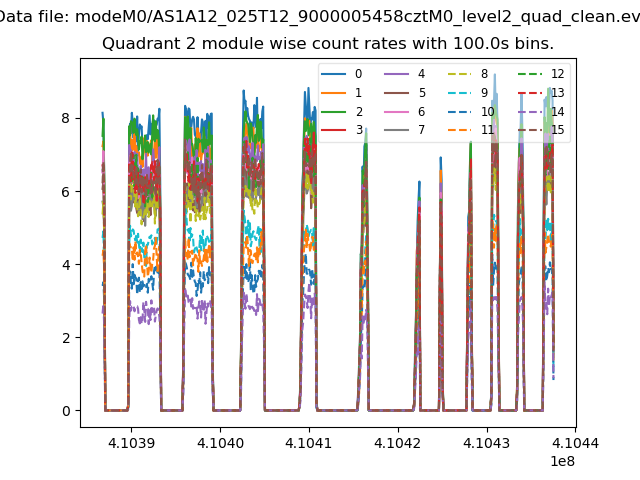 |
 |
| Module-wise count rates for Quadrant D Data is divided into 100 sec bins |
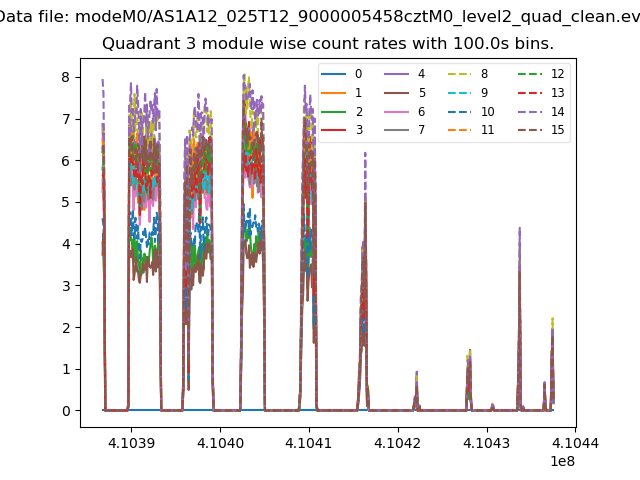 |
 |
| Parameter | Plot |
|---|---|
| CZT HV Monitor | 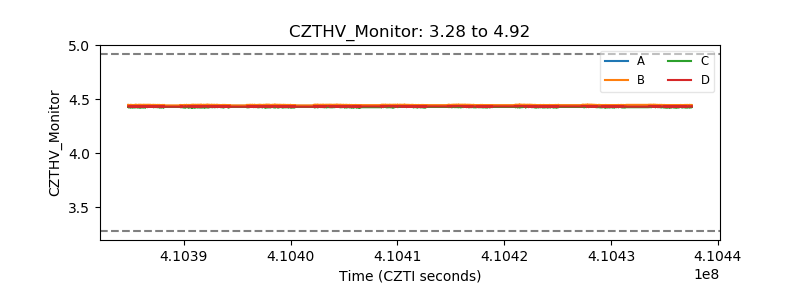 |
| D_VDD | 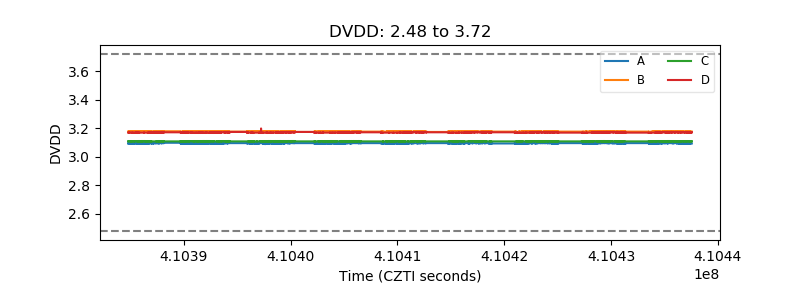 |
| Temperature 1 | 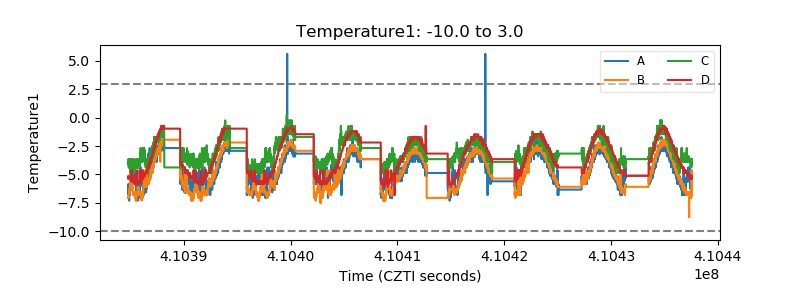 |
| Veto HV Monitor | 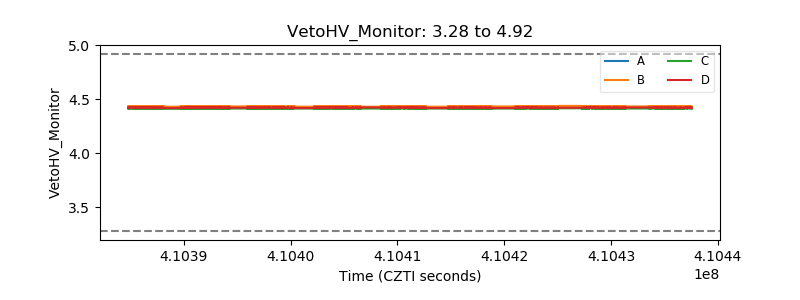 |
| Veto LLD | 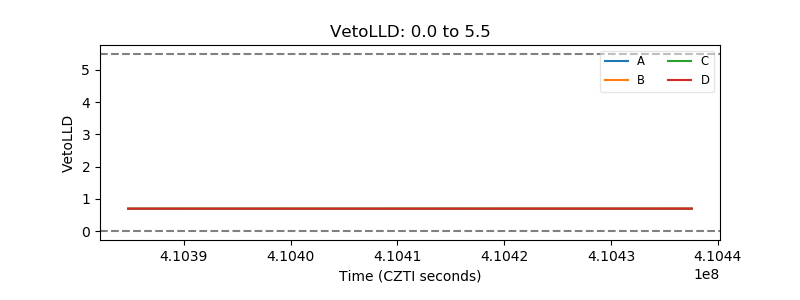 |
| Alpha Counter | 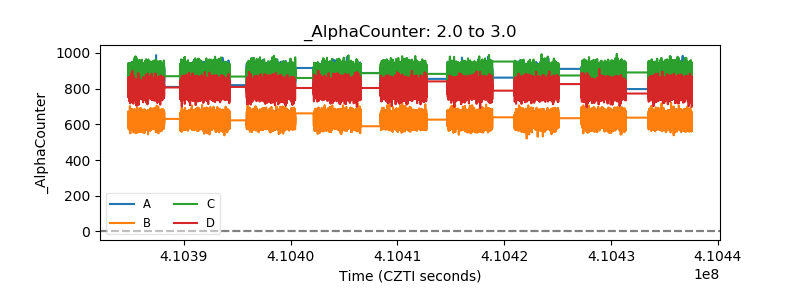 |
| _CPM_Rate | 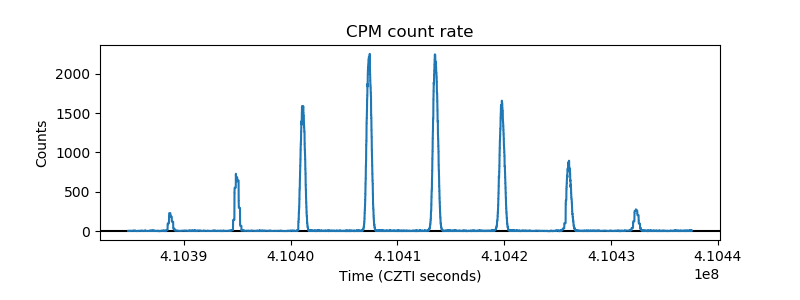 |
| CZT Counter | 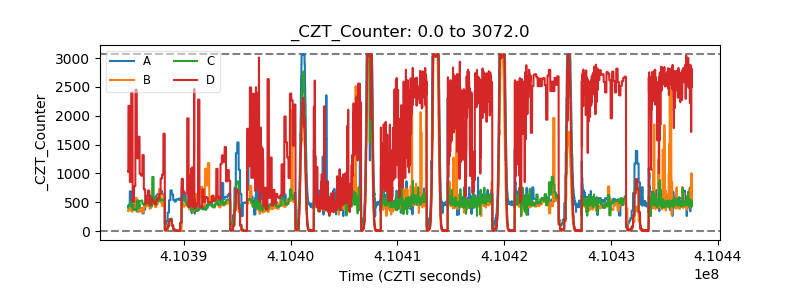 |
| +2.5 Volts monitor | 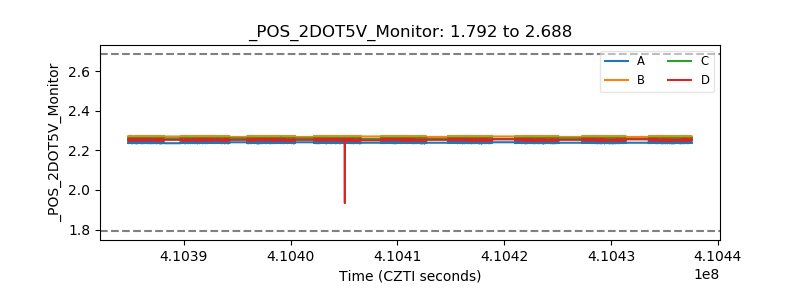 |
| +5 Volts monitor | 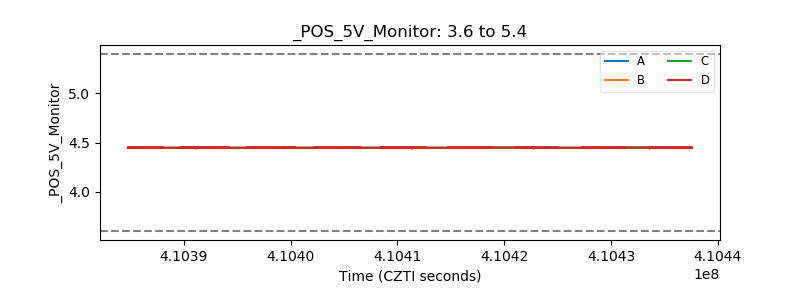 |
| _ROLL_ROT | 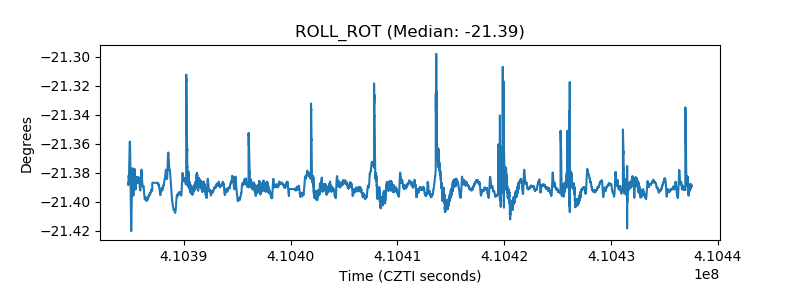 |
| _Roll_DEC | 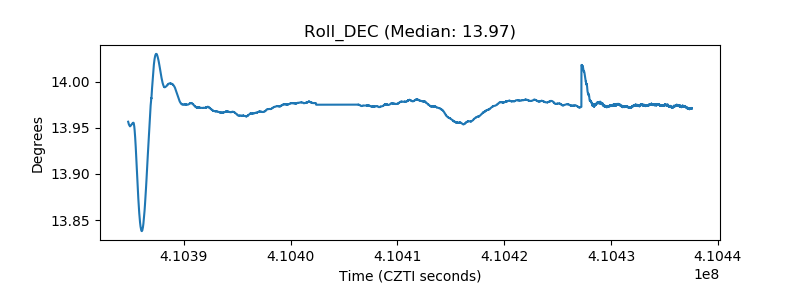 |
| _Roll_RA | 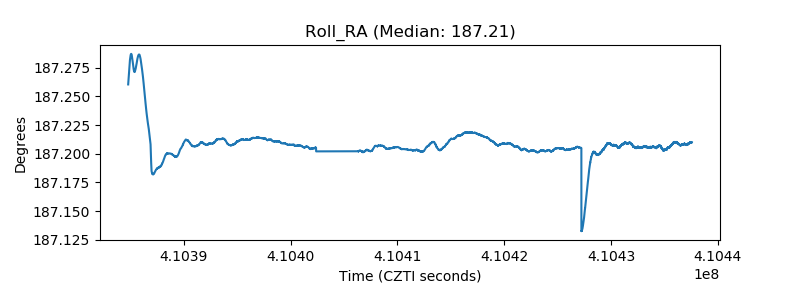 |
| Veto Counter | 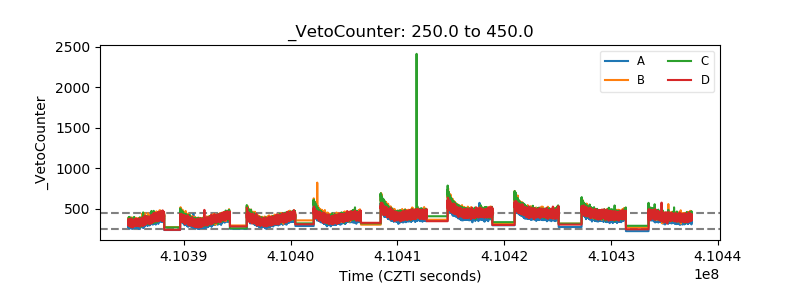 |