| Param | Original file | Final file |
|---|---|---|
| Filename | modeM0/AS1A12_042T01_9000005462cztM0_level2.fits | modeM0/AS1A12_042T01_9000005462cztM0_level2_quad_clean.evt |
| Size (bytes) | 242,239,680 | 331,375,680 |
| Size | 231.0 MB | 316.0 MB |
| Events in quadrant A | 1,589,726 | 2,551,219 |
| Events in quadrant B | 1,510,980 | 2,560,334 |
| Events in quadrant C | 1,548,164 | 2,440,153 |
| Events in quadrant D | 621,092 | 429,962 |
| Mode SS | |||
|---|---|---|---|
| Quadrant | BADHDUFLAG | Total packets | Discarded packets |
| A | 0 | 612 | 0 |
| B | 0 | 612 | 0 |
| C | 0 | 612 | 0 |
| D | 0 | 612 | 0 |
| Mode M0 | |||
|---|---|---|---|
| Quadrant | BADHDUFLAG | Total packets | Discarded packets |
| A | 0 | 69074 | 0 |
| B | 0 | 66201 | 0 |
| C | 0 | 63738 | 0 |
| D | 0 | 231943 | 0 |
| Mode M9 | |||
|---|---|---|---|
| Quadrant | BADHDUFLAG | Total packets | Discarded packets |
| A | 0 | 109 | 0 |
| B | 0 | 109 | 0 |
| C | 0 | 109 | 0 |
| D | 0 | 109 | 0 |
| Quadrant | Total seconds | Saturated seconds | Saturation percentage |
|---|---|---|---|
| A | 29883 | 417 | 1.395442% |
| B | 29883 | 642 | 2.148379% |
| C | 29883 | 147 | 0.491918% |
| D | 29883 | 24571 | 82.224007% |
Noise dominated data is calculated using 1-second bins in cleaned event files. If a bin has >2000 counts, and if more than 50% of those come from <1% of pixels, then it is considered to be noise-dominated and hence unusable.
| Quadrant | # 1 sec bins | Bins with >0 counts | Bins with >2000 counts | High rate bins dominated by noise | Noise dominated (total time) | Noise dominated (detector-on time) | Marked lightcurve |
|---|---|---|---|---|---|---|---|
| A | 40809 | 29884 | 0 | 0 | 0.00% | 0.00% | 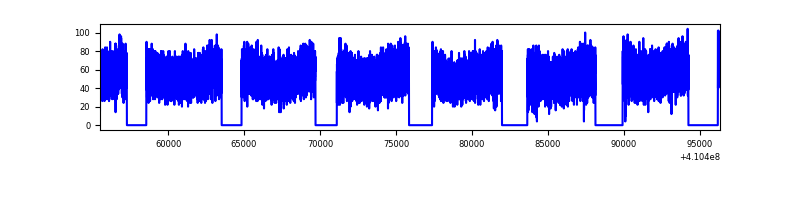 |
| B | 40809 | 29820 | 0 | 0 | 0.00% | 0.00% |  |
| C | 40809 | 29882 | 0 | 0 | 0.00% | 0.00% |  |
| D | 40809 | 29216 | 0 | 0 | 0.00% | 0.00% |  |
Top three noisy pixels from each quadrant. If the there are fewer than three noisy pixels in the level2.evt file, extra rows are filled as -1
| Pixel properties | Quadrant properties | ||||||
|---|---|---|---|---|---|---|---|
| Quadrant | DetID | PixID | Counts | Sigma | Mean | Median | Sigma |
| A | 0 | 29 | 1303 | 8.52 | 415 | 389 | 107.3 |
| A | 9 | 19 | 1296 | 8.46 | 415 | 389 | 107.3 |
| A | 7 | 110 | 1229 | 7.83 | 415 | 389 | 107.3 |
| B | 2 | 9 | 1313 | 11.79 | 399 | 382 | 79.0 |
| B | 5 | 128 | 1052 | 8.48 | 399 | 382 | 79.0 |
| B | 2 | 8 | 1042 | 8.36 | 399 | 382 | 79.0 |
| C | 1 | 81 | 1341 | 8.99 | 409 | 383 | 106.6 |
| C | 3 | 202 | 1323 | 8.82 | 409 | 383 | 106.6 |
| C | 3 | 203 | 1279 | 8.41 | 409 | 383 | 106.6 |
| D | 6 | 67 | 460 | 6.07 | 177 | 161 | 49.2 |
| D | 1 | 3 | 457 | 6.01 | 177 | 161 | 49.2 |
| D | 7 | 3 | 451 | 5.89 | 177 | 161 | 49.2 |
Histogram calculated using DETX and DETY for each event in the final _common_clean file
| Quadrant A | 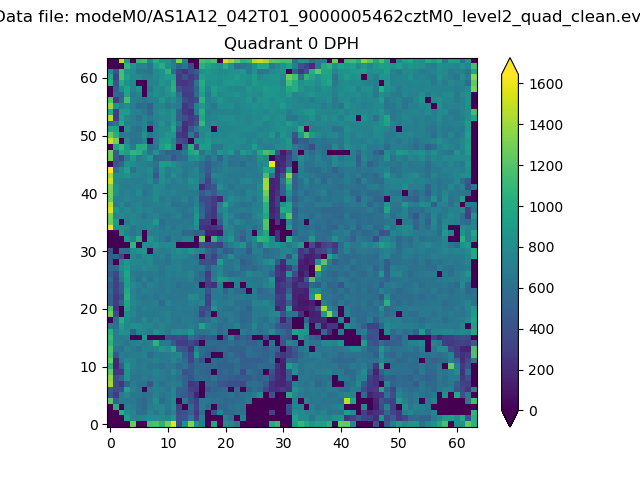 |
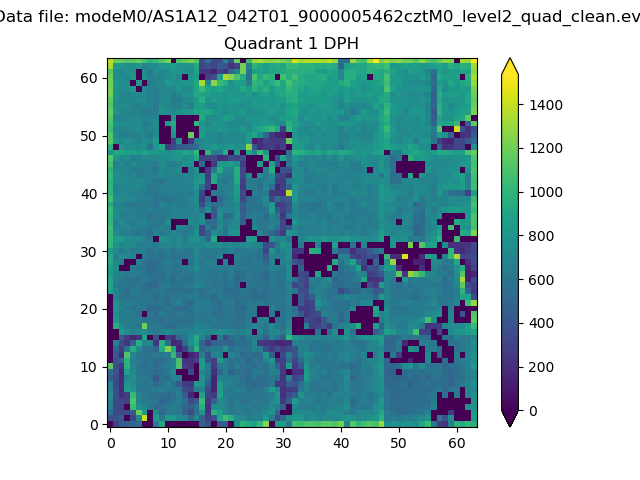 |
Quadrant B |
|---|---|---|---|
| Quadrant D |  |
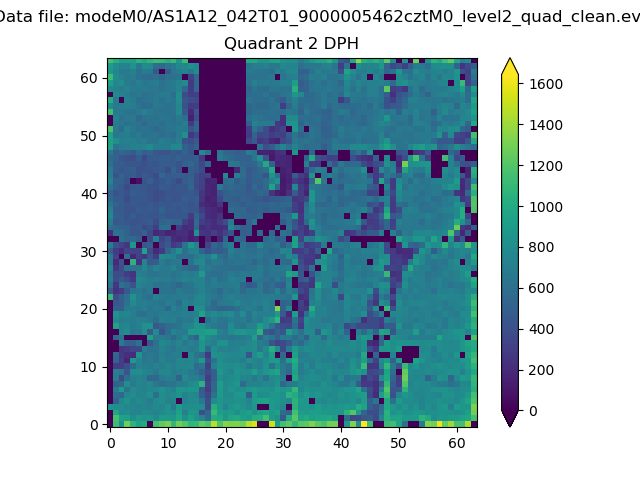 |
Quadrant C |
| Plot type | Count rate plots | Images |
|---|---|---|
| Comparison with Poisson distribution Blue bars denote a histogram of data divided into 1 sec bins. Red curve is a Poisson curve with rate = median count rate of data. |
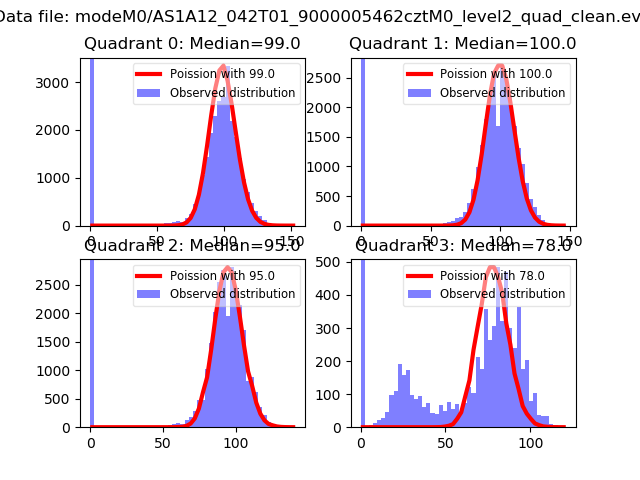 |
 |
| Quadrant-wise count rates Data is divided into 100 sec bins |
 |
|
| Module-wise count rates for Quadrant A Data is divided into 100 sec bins |
 |
 |
| Module-wise count rates for Quadrant B Data is divided into 100 sec bins |
 |
 |
| Module-wise count rates for Quadrant C Data is divided into 100 sec bins |
 |
 |
| Module-wise count rates for Quadrant D Data is divided into 100 sec bins |
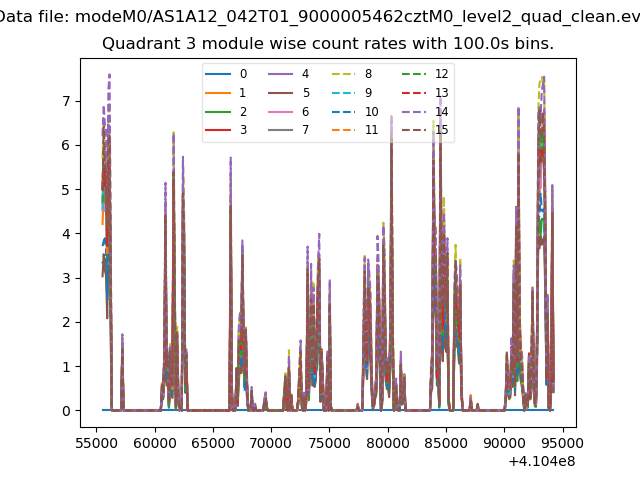 |
 |
| Parameter | Plot |
|---|---|
| CZT HV Monitor |  |
| D_VDD | 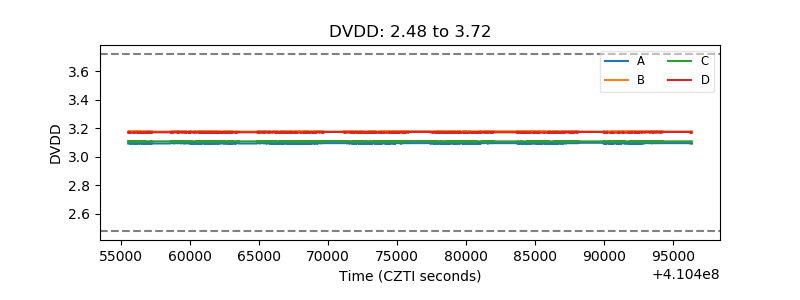 |
| Temperature 1 |  |
| Veto HV Monitor |  |
| Veto LLD |  |
| Alpha Counter |  |
| _CPM_Rate | 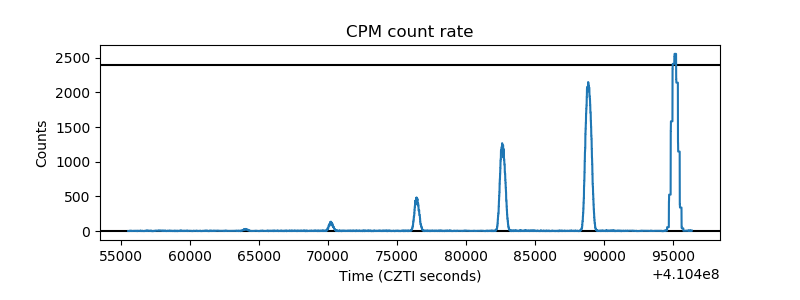 |
| CZT Counter |  |
| +2.5 Volts monitor |  |
| +5 Volts monitor |  |
| _ROLL_ROT | 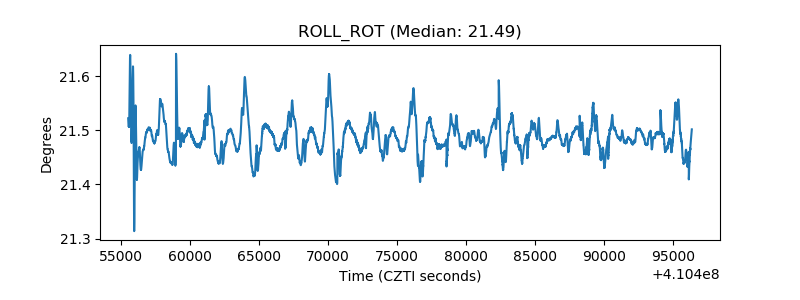 |
| _Roll_DEC |  |
| _Roll_RA | 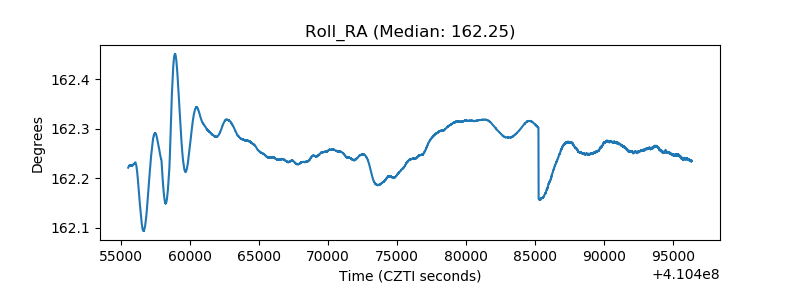 |
| Veto Counter |  |