| Param | Original file | Final file |
|---|---|---|
| Filename | modeM0/AS1A12_044T04_9000005464cztM0_level2.fits | modeM0/AS1A12_044T04_9000005464cztM0_level2_quad_clean.evt |
| Size (bytes) | 195,730,560 | 223,116,480 |
| Size | 186.7 MB | 212.8 MB |
| Events in quadrant A | 1,313,840 | 1,689,428 |
| Events in quadrant B | 1,238,584 | 1,651,150 |
| Events in quadrant C | 1,279,114 | 1,623,085 |
| Events in quadrant D | 528,092 | 233,390 |
| Mode M0 | |||
|---|---|---|---|
| Quadrant | BADHDUFLAG | Total packets | Discarded packets |
| A | 0 | 51666 | 0 |
| B | 0 | 52914 | 0 |
| C | 0 | 49270 | 0 |
| D | 0 | 169903 | 0 |
| Mode SS | |||
|---|---|---|---|
| Quadrant | BADHDUFLAG | Total packets | Discarded packets |
| A | 0 | 464 | 0 |
| B | 0 | 464 | 0 |
| C | 0 | 464 | 0 |
| D | 0 | 464 | 0 |
| Mode M9 | |||
|---|---|---|---|
| Quadrant | BADHDUFLAG | Total packets | Discarded packets |
| A | 0 | 101 | 0 |
| B | 0 | 101 | 0 |
| C | 0 | 101 | 0 |
| D | 0 | 101 | 0 |
| Quadrant | Total seconds | Saturated seconds | Saturation percentage |
|---|---|---|---|
| A | 22651 | 213 | 0.940356% |
| B | 22651 | 550 | 2.428149% |
| C | 22651 | 114 | 0.503289% |
| D | 22651 | 18295 | 80.769061% |
Noise dominated data is calculated using 1-second bins in cleaned event files. If a bin has >2000 counts, and if more than 50% of those come from <1% of pixels, then it is considered to be noise-dominated and hence unusable.
| Quadrant | # 1 sec bins | Bins with >0 counts | Bins with >2000 counts | High rate bins dominated by noise | Noise dominated (total time) | Noise dominated (detector-on time) | Marked lightcurve |
|---|---|---|---|---|---|---|---|
| A | 32783 | 22651 | 0 | 0 | 0.00% | 0.00% | 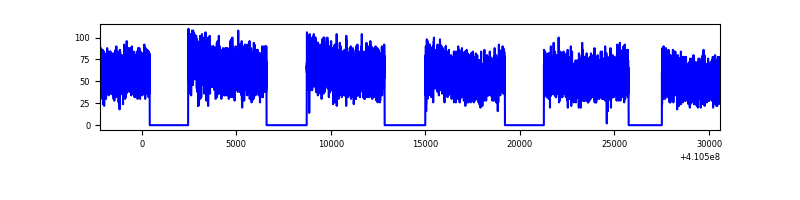 |
| B | 32783 | 22650 | 0 | 0 | 0.00% | 0.00% |  |
| C | 32783 | 22651 | 0 | 0 | 0.00% | 0.00% |  |
| D | 32782 | 22227 | 0 | 0 | 0.00% | 0.00% |  |
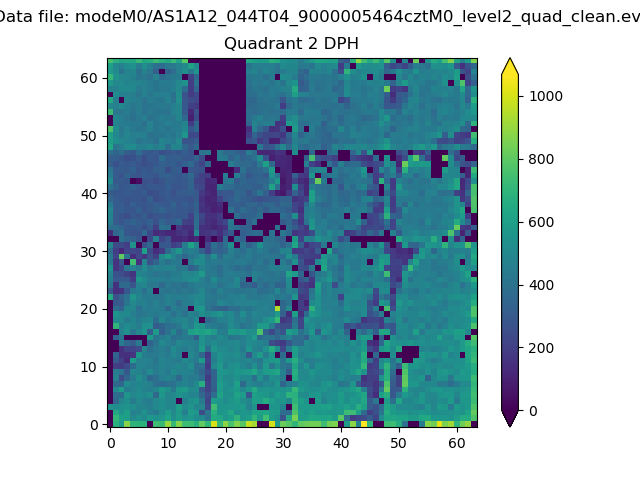
Top three noisy pixels from each quadrant. If the there are fewer than three noisy pixels in the level2.evt file, extra rows are filled as -1
| Pixel properties | Quadrant properties | ||||||
|---|---|---|---|---|---|---|---|
| Quadrant | DetID | PixID | Counts | Sigma | Mean | Median | Sigma |
| A | 0 | 29 | 1111 | 9.24 | 343 | 325 | 85.0 |
| A | 9 | 19 | 1106 | 9.19 | 343 | 325 | 85.0 |
| A | 7 | 110 | 1062 | 8.67 | 343 | 325 | 85.0 |
| B | 2 | 9 | 1062 | 11.26 | 329 | 316 | 66.2 |
| B | 5 | 128 | 903 | 8.86 | 329 | 316 | 66.2 |
| B | 3 | 17 | 841 | 7.93 | 329 | 316 | 66.2 |
| C | 1 | 81 | 1107 | 9.02 | 338 | 320 | 87.2 |
| C | 3 | 202 | 1063 | 8.52 | 338 | 320 | 87.2 |
| C | 1 | 80 | 1035 | 8.2 | 338 | 320 | 87.2 |
| D | 7 | 3 | 401 | 6.41 | 151 | 138 | 41.0 |
| D | 4 | 160 | 389 | 6.12 | 151 | 138 | 41.0 |
| D | 6 | 62 | 387 | 6.07 | 151 | 138 | 41.0 |
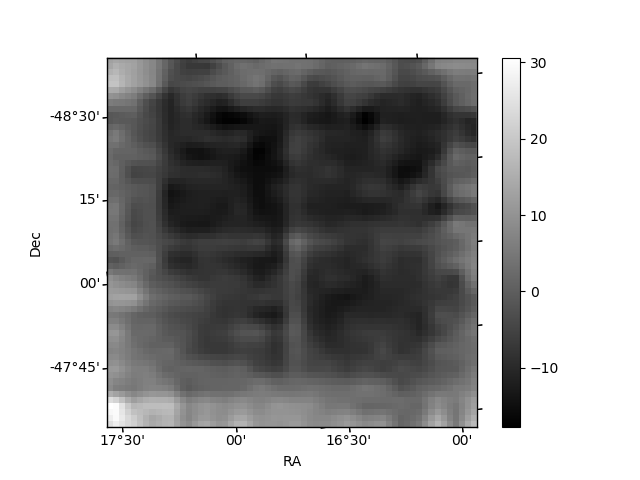
Histogram calculated using DETX and DETY for each event in the final _common_clean file
| Quadrant A | 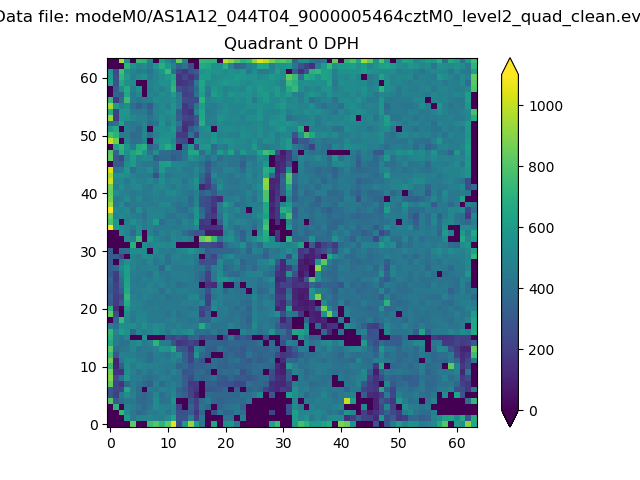 |
 |
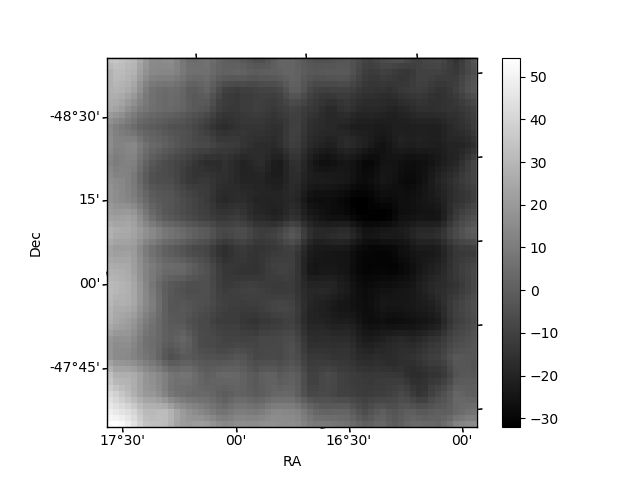
Quadrant B |
|---|---|---|---|
| Quadrant D | 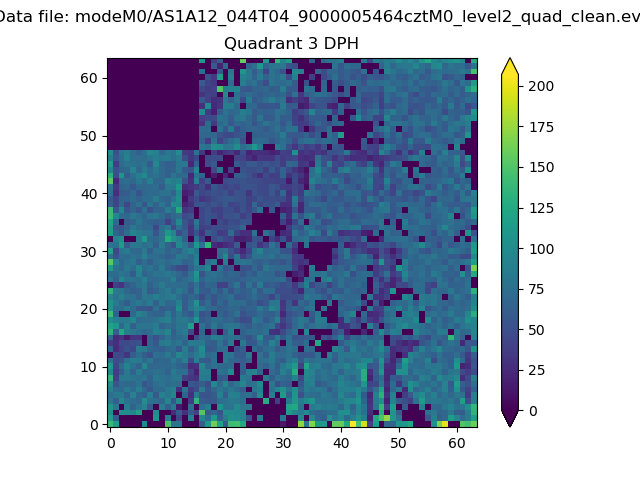 |
 |
Quadrant C |
| Plot type | Count rate plots | Images |
|---|---|---|
| Comparison with Poisson distribution Blue bars denote a histogram of data divided into 1 sec bins. Red curve is a Poisson curve with rate = median count rate of data. |
 |
 |
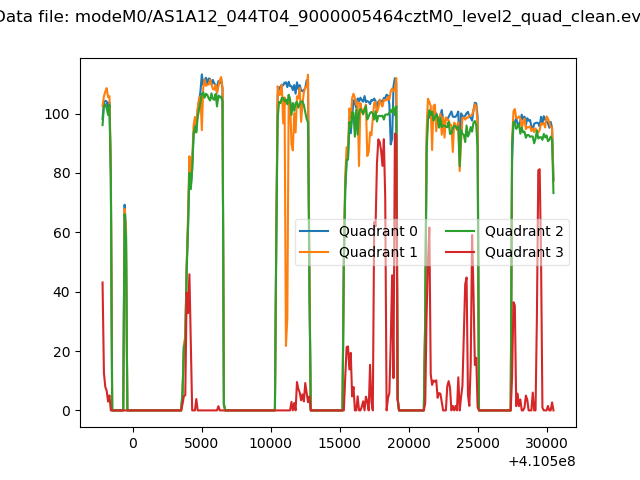
| Quadrant-wise count rates Data is divided into 100 sec bins |
 |
|
| Module-wise count rates for Quadrant A Data is divided into 100 sec bins |
 |
 |
| Module-wise count rates for Quadrant B Data is divided into 100 sec bins |
 |
 |
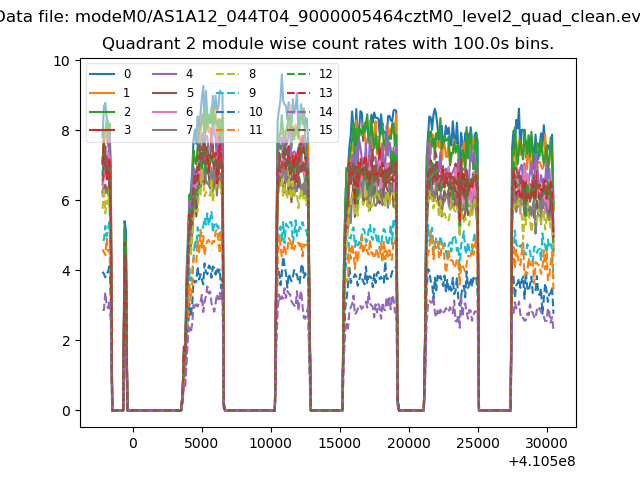
| Module-wise count rates for Quadrant C Data is divided into 100 sec bins |
 |
 |
| Module-wise count rates for Quadrant D Data is divided into 100 sec bins |
 |
 |
| Parameter | Plot |
|---|---|
| CZT HV Monitor | 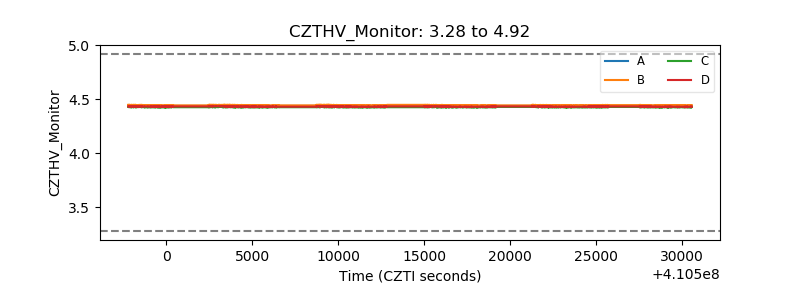 |
| D_VDD |  |
| Temperature 1 |  |
| Veto HV Monitor | 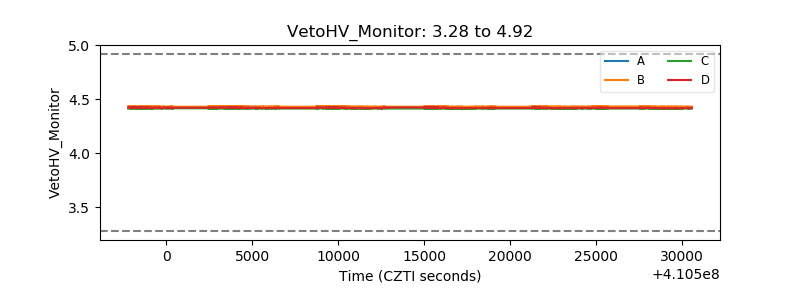 |
| Veto LLD | 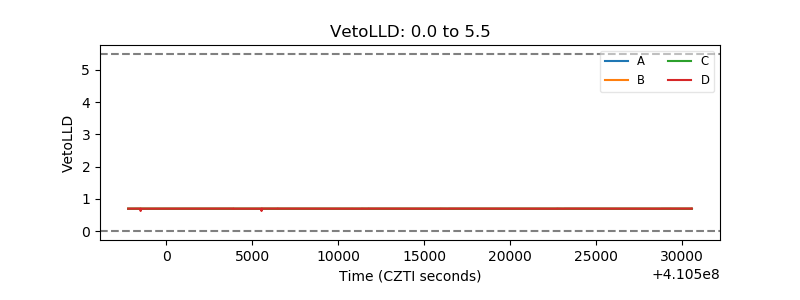 |
| Alpha Counter |  |
| _CPM_Rate |  |
| CZT Counter |  |
| +2.5 Volts monitor |  |
| +5 Volts monitor |  |
| _ROLL_ROT | 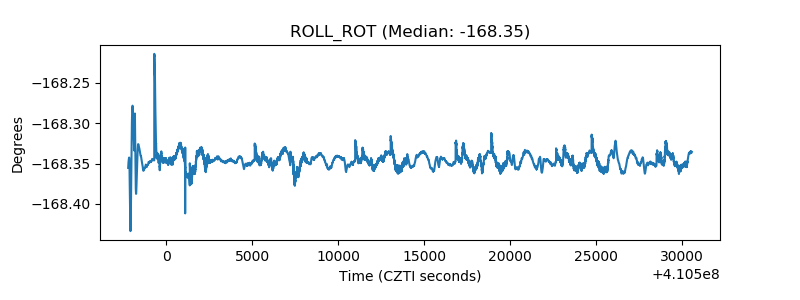 |
| _Roll_DEC |  |
| _Roll_RA | 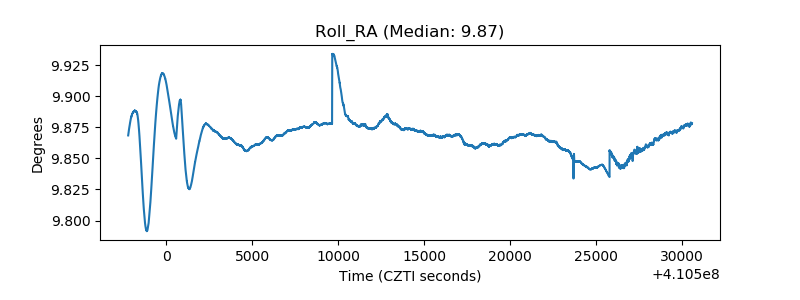 |
| Veto Counter |  |