| Param | Original file | Final file |
|---|---|---|
| Filename | modeM0/AS1A12_061T07_9000005468cztM0_level2.fits | modeM0/AS1A12_061T07_9000005468cztM0_level2_quad_clean.evt |
| Size (bytes) | 788,028,480 | 751,337,280 |
| Size | 751.5 MB | 716.5 MB |
| Events in quadrant A | 4,855,948 | 4,637,818 |
| Events in quadrant B | 4,657,098 | 4,558,735 |
| Events in quadrant C | 4,794,208 | 4,430,335 |
| Events in quadrant D | 3,775,488 | 3,349,881 |
| Mode M9 | |||
|---|---|---|---|
| Quadrant | BADHDUFLAG | Total packets | Discarded packets |
| A | 0 | 325 | 0 |
| B | 0 | 325 | 0 |
| C | 0 | 325 | 0 |
| D | 0 | 325 | 0 |
| Mode SS | |||
|---|---|---|---|
| Quadrant | BADHDUFLAG | Total packets | Discarded packets |
| A | 0 | 1722 | 0 |
| B | 0 | 1722 | 0 |
| C | 0 | 1722 | 0 |
| D | 0 | 1722 | 0 |
| Mode M0 | |||
|---|---|---|---|
| Quadrant | BADHDUFLAG | Total packets | Discarded packets |
| A | 0 | 184500 | 0 |
| B | 0 | 184801 | 0 |
| C | 0 | 179891 | 0 |
| D | 0 | 364652 | 0 |
| Quadrant | Total seconds | Saturated seconds | Saturation percentage |
|---|---|---|---|
| A | 84258 | 432 | 0.512711% |
| B | 84258 | 1148 | 1.362482% |
| C | 84258 | 222 | 0.263476% |
| D | 84258 | 15056 | 17.868926% |
Noise dominated data is calculated using 1-second bins in cleaned event files. If a bin has >2000 counts, and if more than 50% of those come from <1% of pixels, then it is considered to be noise-dominated and hence unusable.
| Quadrant | # 1 sec bins | Bins with >0 counts | Bins with >2000 counts | High rate bins dominated by noise | Noise dominated (total time) | Noise dominated (detector-on time) | Marked lightcurve |
|---|---|---|---|---|---|---|---|
| A | 116702 | 84256 | 0 | 0 | 0.00% | 0.00% | 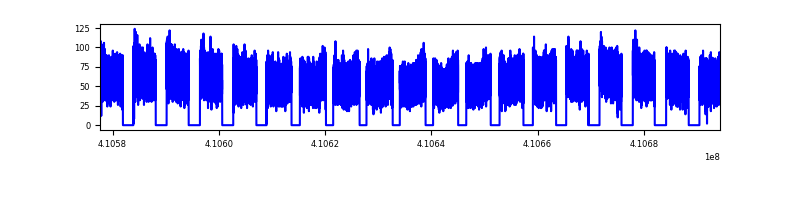 |
| B | 116702 | 84254 | 0 | 0 | 0.00% | 0.00% | 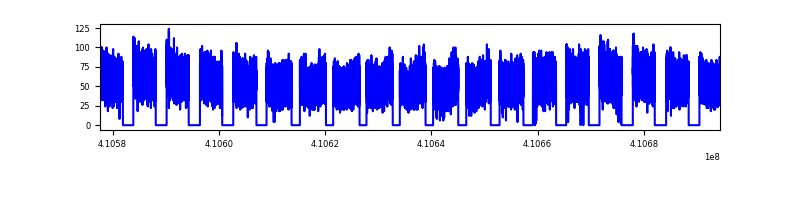 |
| C | 116702 | 84253 | 0 | 0 | 0.00% | 0.00% | 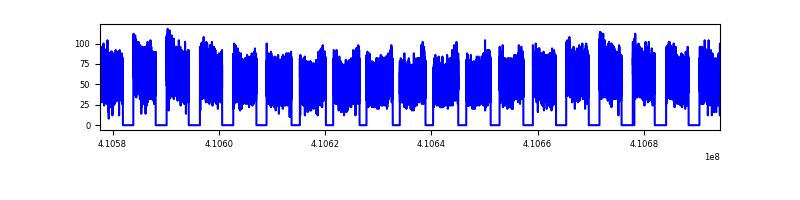 |
| D | 116702 | 84153 | 0 | 0 | 0.00% | 0.00% | 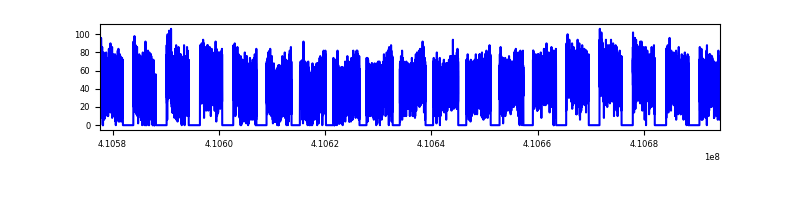 |
Top three noisy pixels from each quadrant. If the there are fewer than three noisy pixels in the level2.evt file, extra rows are filled as -1
| Pixel properties | Quadrant properties | ||||||
|---|---|---|---|---|---|---|---|
| Quadrant | DetID | PixID | Counts | Sigma | Mean | Median | Sigma |
| A | 7 | 110 | 4056 | 9.02 | 1266 | 1187 | 318.2 |
| A | 9 | 19 | 3946 | 8.67 | 1266 | 1187 | 318.2 |
| A | 0 | 29 | 3857 | 8.39 | 1266 | 1187 | 318.2 |
| B | 2 | 9 | 4072 | 12.11 | 1232 | 1177 | 239.0 |
| B | 2 | 8 | 3358 | 9.13 | 1232 | 1177 | 239.0 |
| B | 3 | 17 | 3228 | 8.58 | 1232 | 1177 | 239.0 |
| C | 1 | 81 | 4164 | 9.21 | 1267 | 1191 | 322.8 |
| C | 1 | 80 | 4036 | 8.81 | 1267 | 1191 | 322.8 |
| C | 3 | 203 | 3806 | 8.1 | 1267 | 1191 | 322.8 |
| D | 7 | 3 | 2828 | 6.37 | 1080 | 985 | 289.4 |
| D | 10 | 189 | 2797 | 6.26 | 1080 | 985 | 289.4 |
| D | 10 | 113 | 2760 | 6.13 | 1080 | 985 | 289.4 |
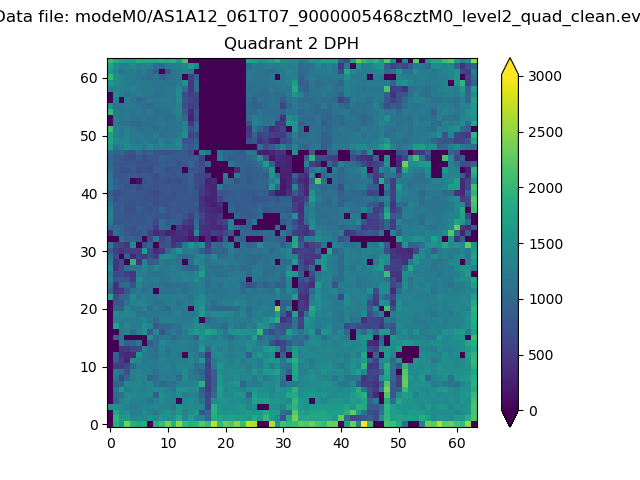
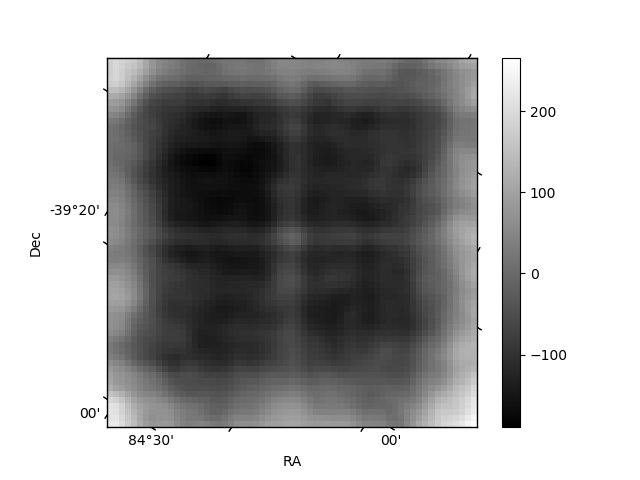
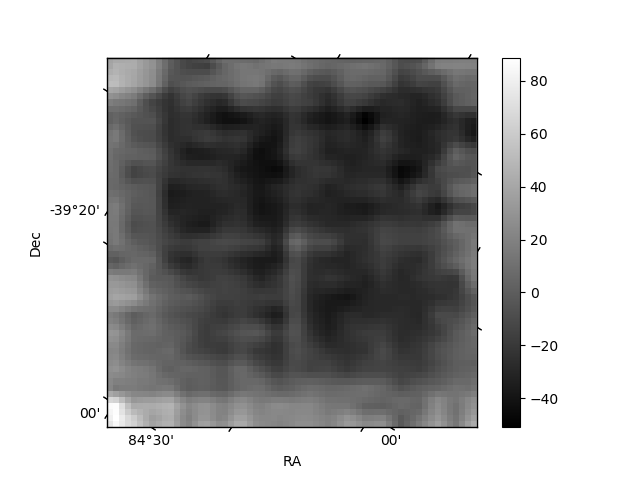
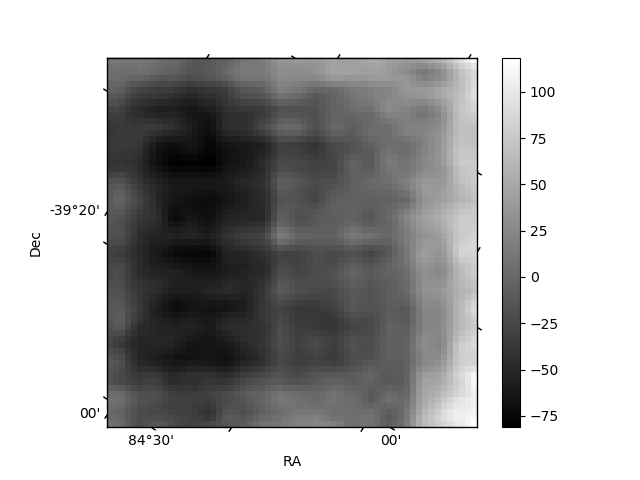
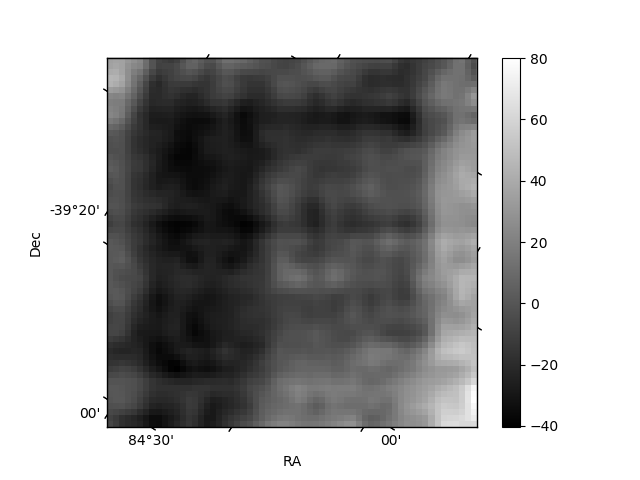
Histogram calculated using DETX and DETY for each event in the final _common_clean file
| Quadrant A | 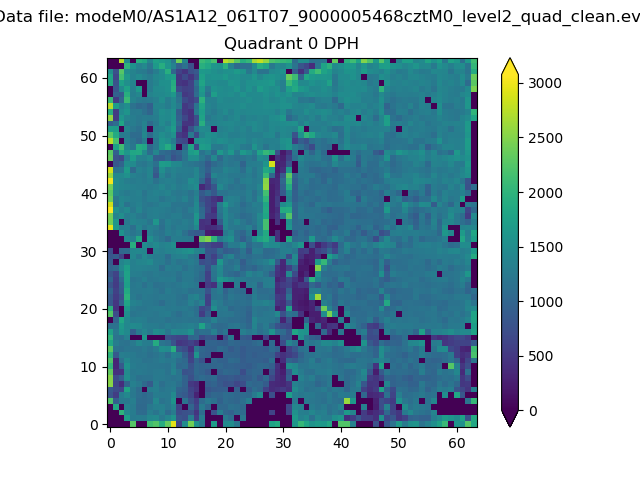 |
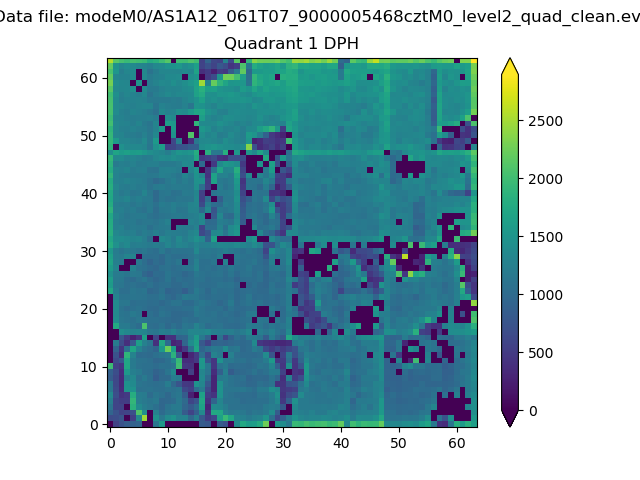 |
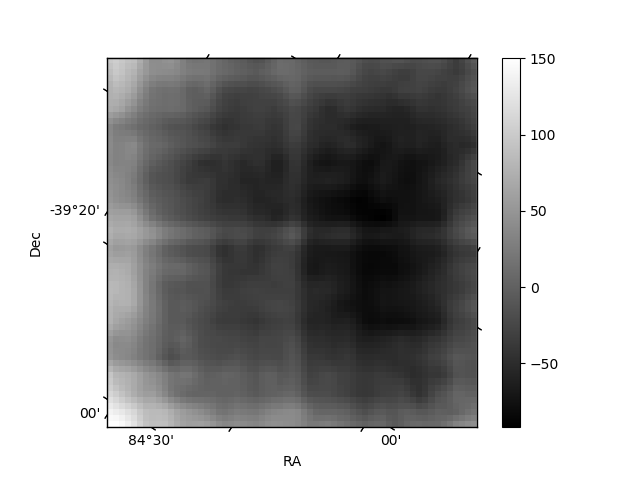
Quadrant B |
|---|---|---|---|
| Quadrant D | 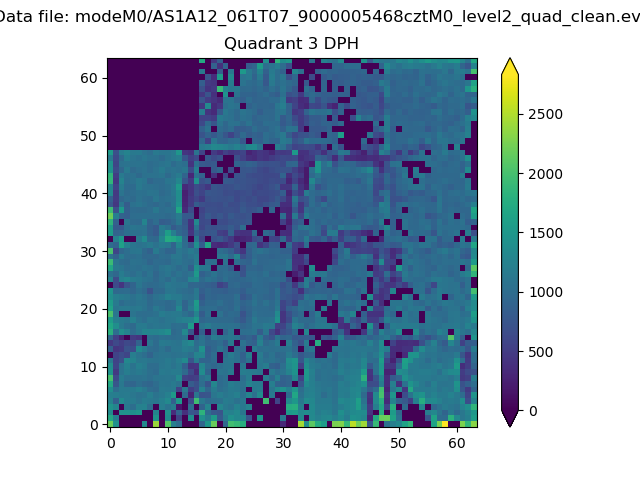 |
 |
Quadrant C |
| Plot type | Count rate plots | Images |
|---|---|---|
| Comparison with Poisson distribution Blue bars denote a histogram of data divided into 1 sec bins. Red curve is a Poisson curve with rate = median count rate of data. |
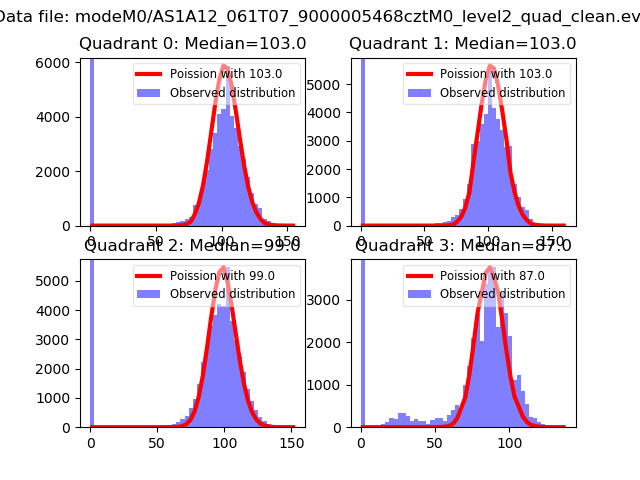 |
 |
| Quadrant-wise count rates Data is divided into 100 sec bins |
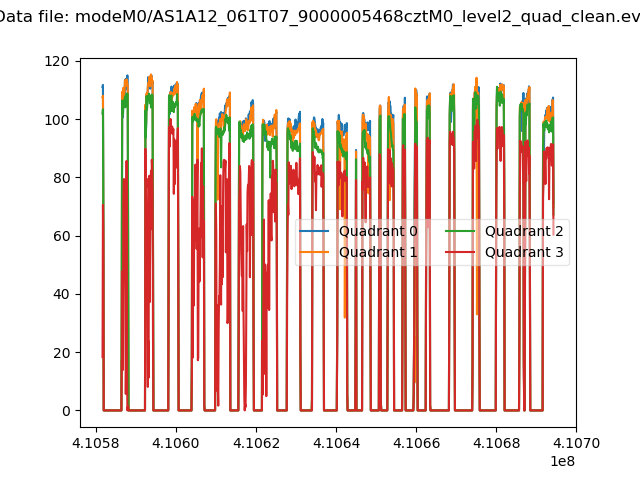 |
|
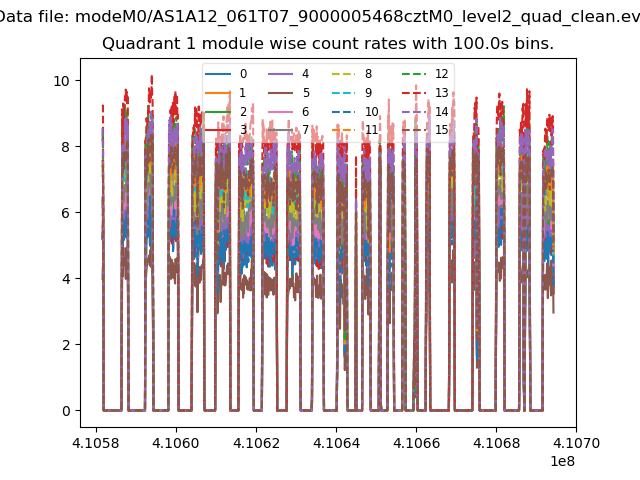
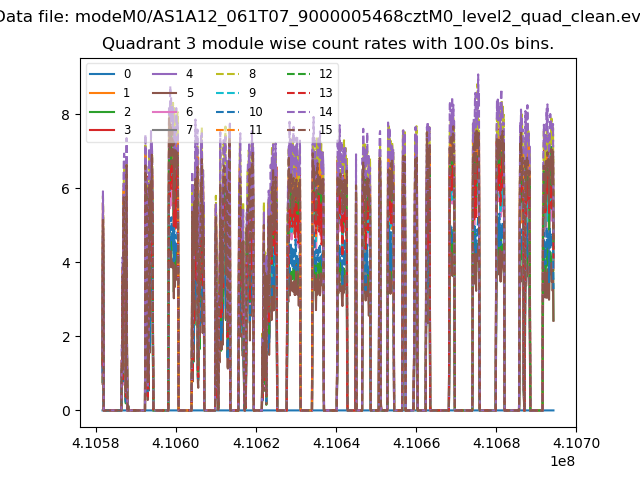
| Module-wise count rates for Quadrant A Data is divided into 100 sec bins |
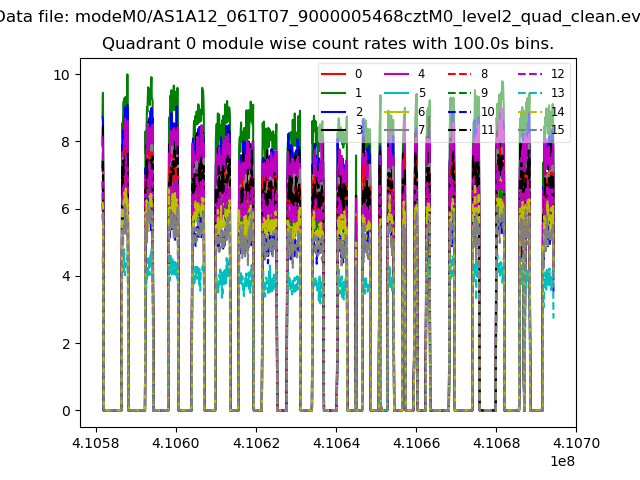 |
 |
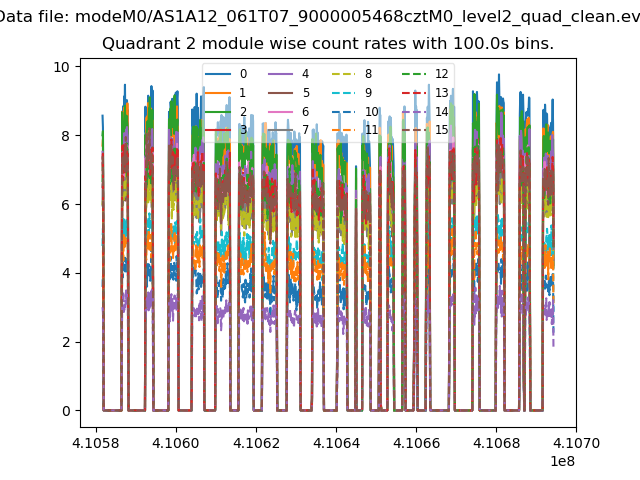
| Module-wise count rates for Quadrant B Data is divided into 100 sec bins |
 |
 |
| Module-wise count rates for Quadrant C Data is divided into 100 sec bins |
 |
 |
| Module-wise count rates for Quadrant D Data is divided into 100 sec bins |
 |
 |
| Parameter | Plot |
|---|---|
| CZT HV Monitor | 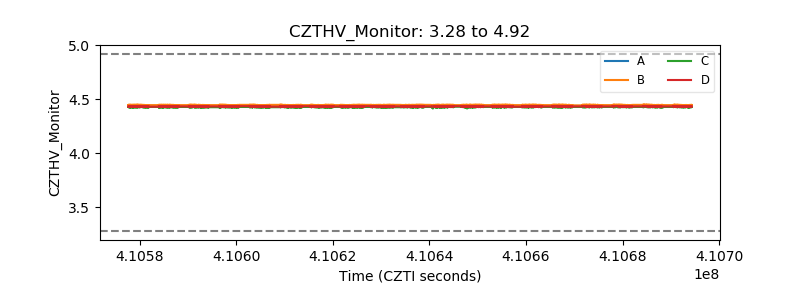 |
| D_VDD | 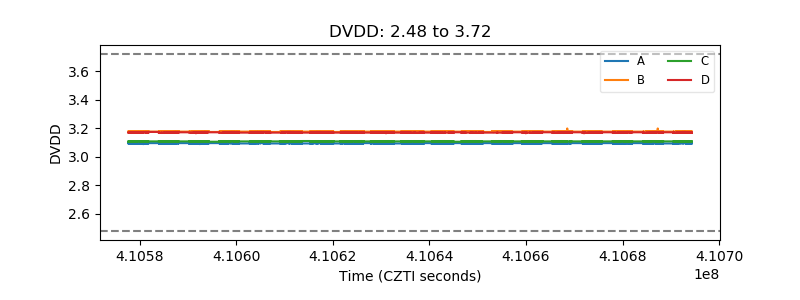 |
| Temperature 1 | 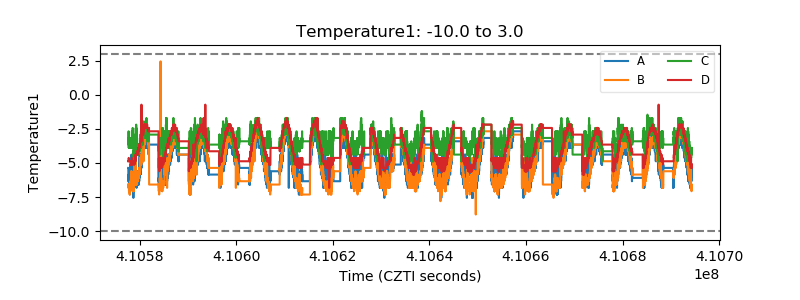 |
| Veto HV Monitor | 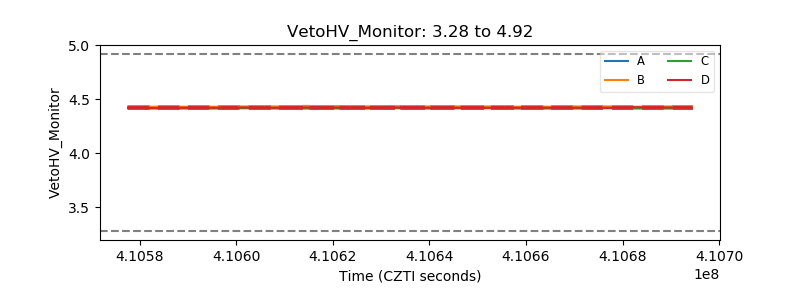 |
| Veto LLD | 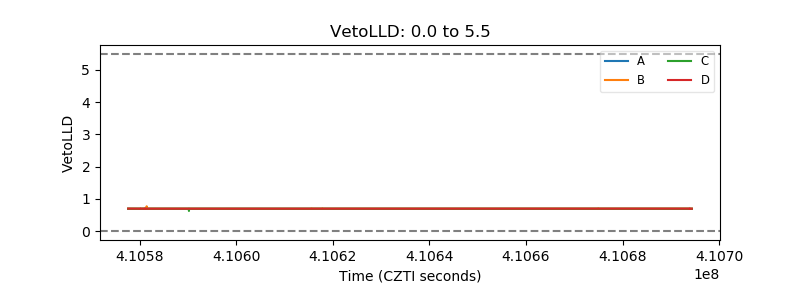 |
| Alpha Counter | 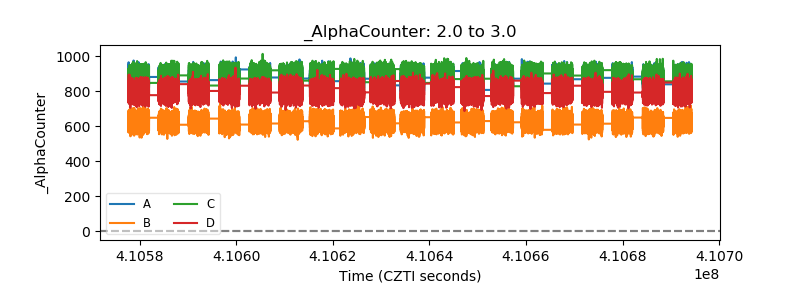 |
| _CPM_Rate | 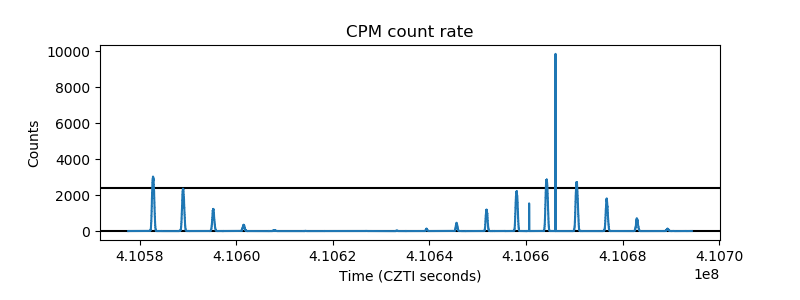 |
| CZT Counter | 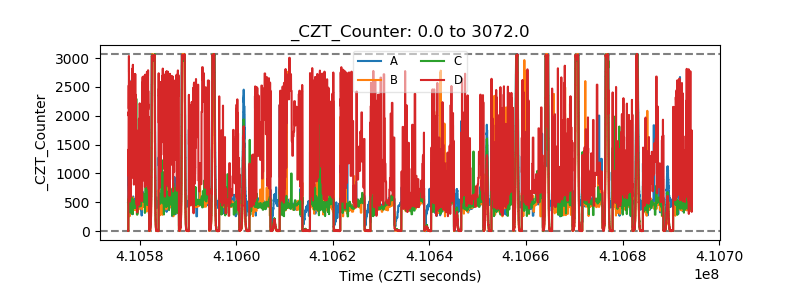 |
| +2.5 Volts monitor |  |
| +5 Volts monitor | 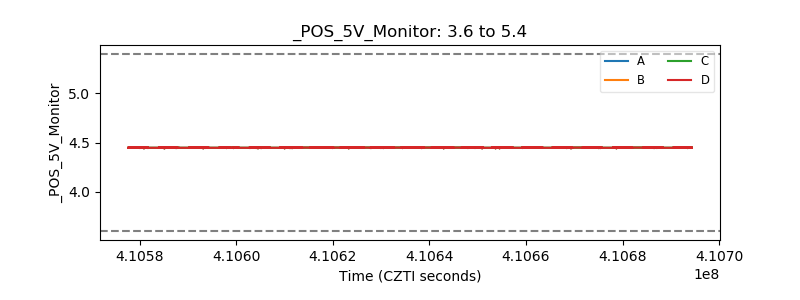 |
| _ROLL_ROT | 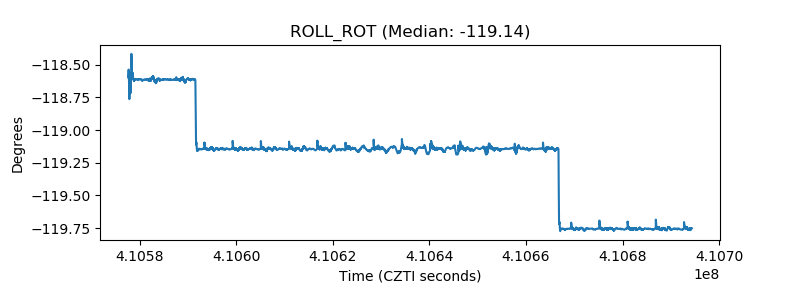 |
| _Roll_DEC | 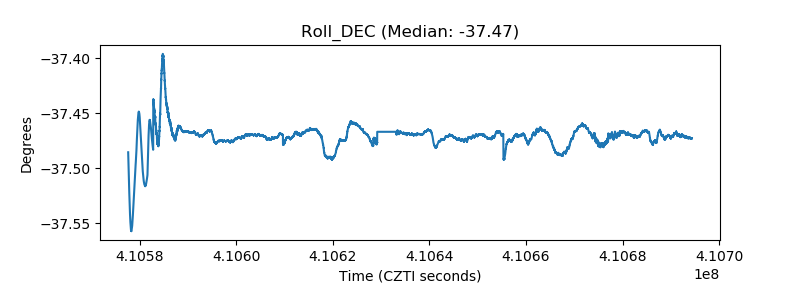 |
| _Roll_RA | 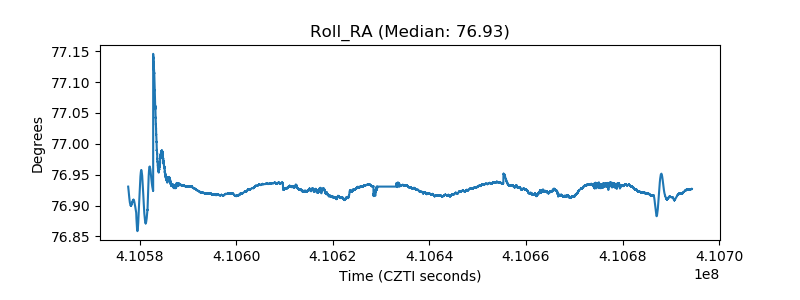 |
| Veto Counter | 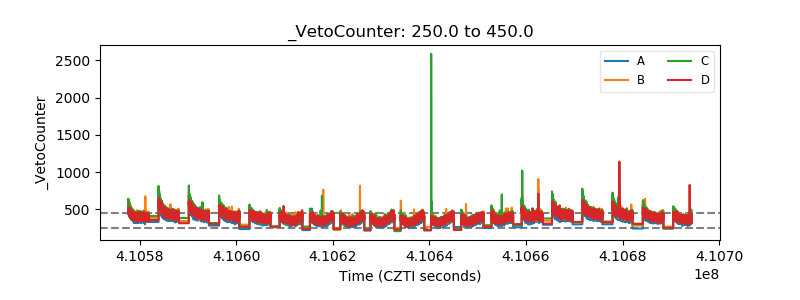 |