| Param | Original file | Final file |
|---|---|---|
| Filename | modeM0/AS1T05_074T01_9000005472cztM0_level2.fits | modeM0/AS1T05_074T01_9000005472cztM0_level2_quad_clean.evt |
| Size (bytes) | 284,575,680 | 260,415,360 |
| Size | 271.4 MB | 248.4 MB |
| Events in quadrant A | 1,739,824 | 1,626,804 |
| Events in quadrant B | 1,648,900 | 1,454,534 |
| Events in quadrant C | 1,689,160 | 1,495,943 |
| Events in quadrant D | 1,260,564 | 1,033,979 |
| Mode M9 | |||
|---|---|---|---|
| Quadrant | BADHDUFLAG | Total packets | Discarded packets |
| A | 0 | 132 | 0 |
| B | 0 | 132 | 0 |
| C | 0 | 132 | 0 |
| D | 0 | 132 | 0 |
| Mode M0 | |||
|---|---|---|---|
| Quadrant | BADHDUFLAG | Total packets | Discarded packets |
| A | 0 | 83591 | 0 |
| B | 0 | 93959 | 0 |
| C | 0 | 99019 | 0 |
| D | 0 | 169080 | 0 |
| Mode SS | |||
|---|---|---|---|
| Quadrant | BADHDUFLAG | Total packets | Discarded packets |
| A | 0 | 676 | 0 |
| B | 0 | 676 | 0 |
| C | 0 | 676 | 0 |
| D | 0 | 676 | 0 |
| Quadrant | Total seconds | Saturated seconds | Saturation percentage |
|---|---|---|---|
| A | 33094 | 1171 | 3.538406% |
| B | 33094 | 2809 | 8.487943% |
| C | 33094 | 1894 | 5.723092% |
| D | 33094 | 8689 | 26.255515% |
Noise dominated data is calculated using 1-second bins in cleaned event files. If a bin has >2000 counts, and if more than 50% of those come from <1% of pixels, then it is considered to be noise-dominated and hence unusable.
| Quadrant | # 1 sec bins | Bins with >0 counts | Bins with >2000 counts | High rate bins dominated by noise | Noise dominated (total time) | Noise dominated (detector-on time) | Marked lightcurve |
|---|---|---|---|---|---|---|---|
| A | 46267 | 33091 | 0 | 0 | 0.00% | 0.00% | 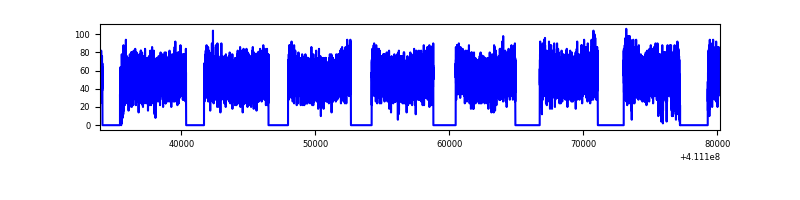 |
| B | 46267 | 33091 | 0 | 0 | 0.00% | 0.00% |  |
| C | 46267 | 33091 | 0 | 0 | 0.00% | 0.00% | 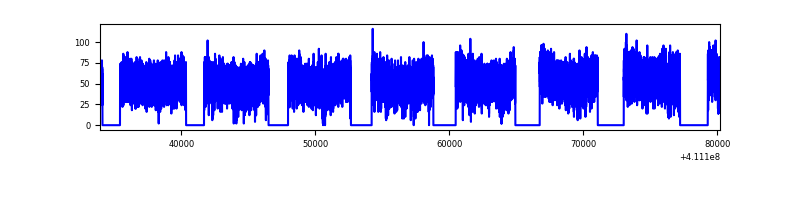 |
| D | 46266 | 32820 | 0 | 0 | 0.00% | 0.00% |  |
Top three noisy pixels from each quadrant. If the there are fewer than three noisy pixels in the level2.evt file, extra rows are filled as -1
| Pixel properties | Quadrant properties | ||||||
|---|---|---|---|---|---|---|---|
| Quadrant | DetID | PixID | Counts | Sigma | Mean | Median | Sigma |
| A | 7 | 110 | 1494 | 9.31 | 453 | 427 | 114.6 |
| A | 0 | 29 | 1429 | 8.74 | 453 | 427 | 114.6 |
| A | 9 | 19 | 1409 | 8.57 | 453 | 427 | 114.6 |
| B | 2 | 9 | 1362 | 10.93 | 436 | 415 | 86.6 |
| B | 3 | 80 | 1304 | 10.26 | 436 | 415 | 86.6 |
| B | 5 | 128 | 1167 | 8.68 | 436 | 415 | 86.6 |
| C | 1 | 81 | 1472 | 9.11 | 446 | 418 | 115.7 |
| C | 1 | 80 | 1392 | 8.42 | 446 | 418 | 115.7 |
| C | 3 | 202 | 1359 | 8.13 | 446 | 418 | 115.7 |
| D | 10 | 189 | 939 | 6.36 | 359 | 328 | 96.0 |
| D | 4 | 160 | 912 | 6.08 | 359 | 328 | 96.0 |
| D | 7 | 3 | 910 | 6.06 | 359 | 328 | 96.0 |
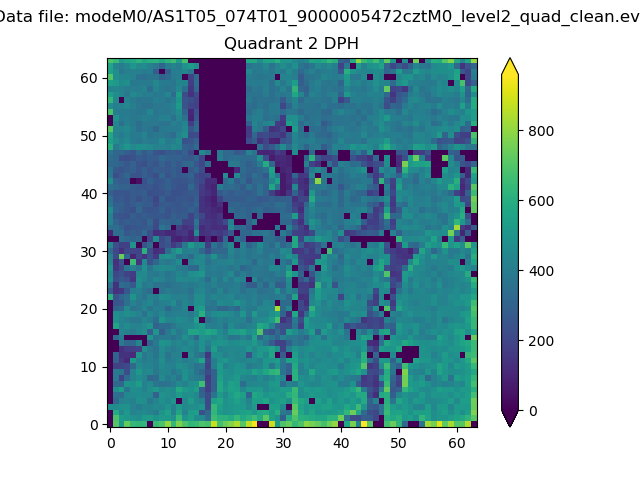
Histogram calculated using DETX and DETY for each event in the final _common_clean file
| Quadrant A | 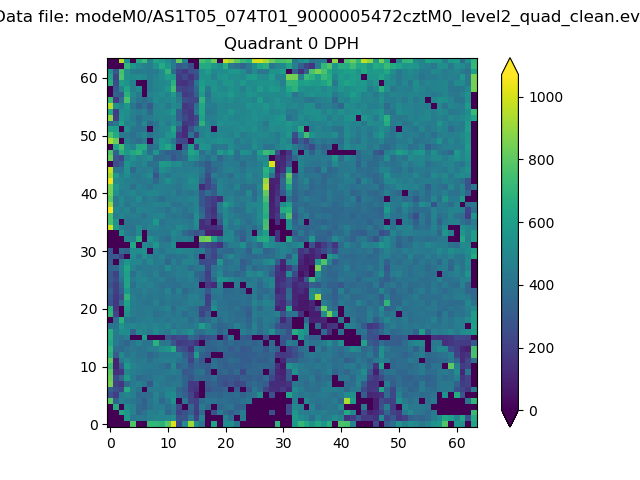 |
 |
Quadrant B |
|---|---|---|---|
| Quadrant D | 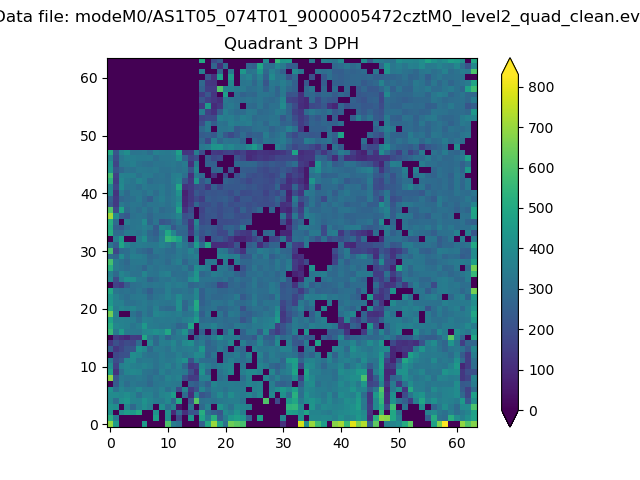 |
 |
Quadrant C |
| Plot type | Count rate plots | Images |
|---|---|---|
| Comparison with Poisson distribution Blue bars denote a histogram of data divided into 1 sec bins. Red curve is a Poisson curve with rate = median count rate of data. |
 |
 |
| Quadrant-wise count rates Data is divided into 100 sec bins |
 |
|
| Module-wise count rates for Quadrant A Data is divided into 100 sec bins |
 |
 |
| Module-wise count rates for Quadrant B Data is divided into 100 sec bins |
 |
 |
| Module-wise count rates for Quadrant C Data is divided into 100 sec bins |
 |
 |
| Module-wise count rates for Quadrant D Data is divided into 100 sec bins |
 |
 |
| Parameter | Plot |
|---|---|
| CZT HV Monitor |  |
| D_VDD | 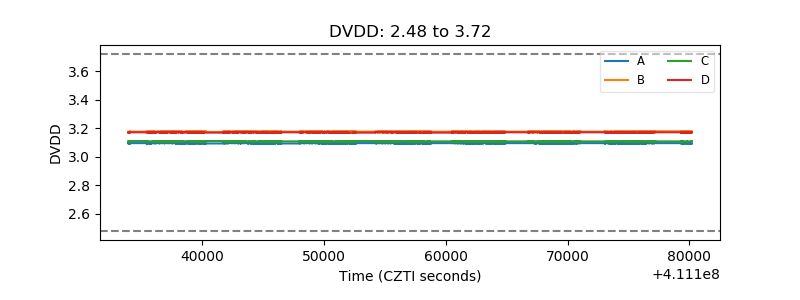 |
| Temperature 1 |  |
| Veto HV Monitor |  |
| Veto LLD |  |
| Alpha Counter |  |
| _CPM_Rate |  |
| CZT Counter | 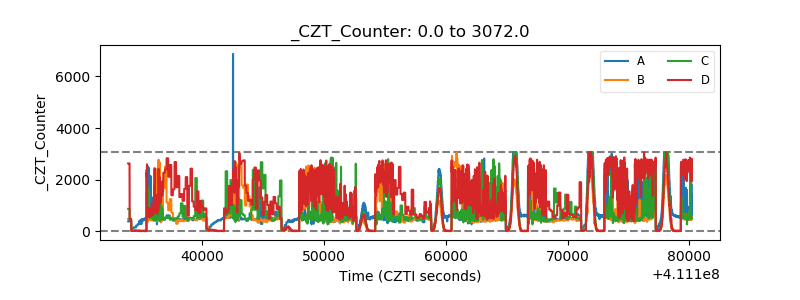 |
| +2.5 Volts monitor | 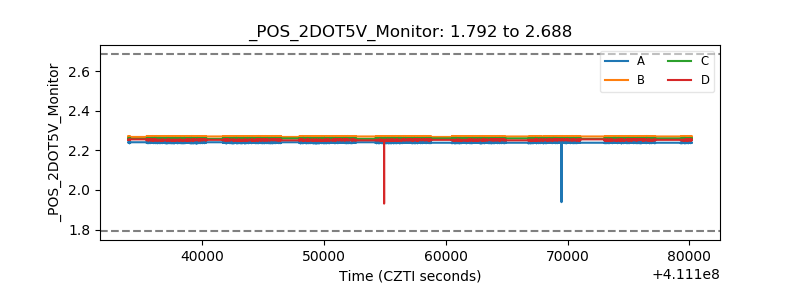 |
| +5 Volts monitor |  |
| _ROLL_ROT |  |
| _Roll_DEC |  |
| _Roll_RA | 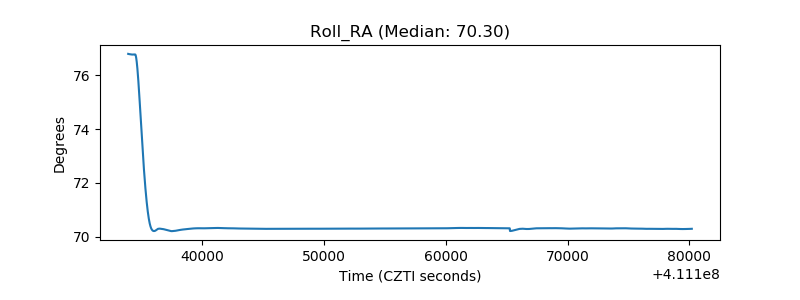 |
| Veto Counter |  |