| Param | Original file | Final file |
|---|---|---|
| Filename | modeM0/AS1A12_025T17_9000005476cztM0_level2.fits | modeM0/AS1A12_025T17_9000005476cztM0_level2_quad_clean.evt |
| Size (bytes) | 482,616,000 | 497,499,840 |
| Size | 460.3 MB | 474.5 MB |
| Events in quadrant A | 2,683,602 | 2,635,460 |
| Events in quadrant B | 2,856,304 | 3,111,061 |
| Events in quadrant C | 2,882,358 | 2,925,820 |
| Events in quadrant D | 2,479,994 | 2,685,004 |
| Mode M0 | |||
|---|---|---|---|
| Quadrant | BADHDUFLAG | Total packets | Discarded packets |
| A | 0 | 199639 | 0 |
| B | 0 | 113837 | 0 |
| C | 0 | 130346 | 0 |
| D | 0 | 139206 | 0 |
| Mode SS | |||
|---|---|---|---|
| Quadrant | BADHDUFLAG | Total packets | Discarded packets |
| A | 0 | 1104 | 0 |
| B | 0 | 1104 | 0 |
| C | 0 | 1104 | 0 |
| D | 0 | 1104 | 0 |
| Mode M9 | |||
|---|---|---|---|
| Quadrant | BADHDUFLAG | Total packets | Discarded packets |
| A | 0 | 206 | 0 |
| B | 0 | 206 | 0 |
| C | 0 | 206 | 0 |
| D | 0 | 206 | 0 |
| Quadrant | Total seconds | Saturated seconds | Saturation percentage |
|---|---|---|---|
| A | 54065 | 7733 | 14.303154% |
| B | 54065 | 322 | 0.595579% |
| C | 54065 | 1049 | 1.940257% |
| D | 54065 | 2652 | 4.905207% |
Noise dominated data is calculated using 1-second bins in cleaned event files. If a bin has >2000 counts, and if more than 50% of those come from <1% of pixels, then it is considered to be noise-dominated and hence unusable.
| Quadrant | # 1 sec bins | Bins with >0 counts | Bins with >2000 counts | High rate bins dominated by noise | Noise dominated (total time) | Noise dominated (detector-on time) | Marked lightcurve |
|---|---|---|---|---|---|---|---|
| A | 74528 | 53807 | 0 | 0 | 0.00% | 0.00% |  |
| B | 74528 | 54065 | 0 | 0 | 0.00% | 0.00% |  |
| C | 74528 | 54058 | 0 | 0 | 0.00% | 0.00% |  |
| D | 74528 | 54029 | 0 | 0 | 0.00% | 0.00% |  |
Top three noisy pixels from each quadrant. If the there are fewer than three noisy pixels in the level2.evt file, extra rows are filled as -1
| Pixel properties | Quadrant properties | ||||||
|---|---|---|---|---|---|---|---|
| Quadrant | DetID | PixID | Counts | Sigma | Mean | Median | Sigma |
| A | 9 | 19 | 2177 | 8.6 | 701 | 656 | 176.9 |
| A | 7 | 110 | 2164 | 8.53 | 701 | 656 | 176.9 |
| A | 0 | 29 | 2152 | 8.46 | 701 | 656 | 176.9 |
| B | 2 | 9 | 2349 | 11.0 | 754 | 719 | 148.2 |
| B | 3 | 80 | 2257 | 10.38 | 754 | 719 | 148.2 |
| B | 5 | 128 | 2034 | 8.87 | 754 | 719 | 148.2 |
| C | 1 | 81 | 2444 | 8.81 | 762 | 712 | 196.6 |
| C | 1 | 80 | 2361 | 8.39 | 762 | 712 | 196.6 |
| C | 1 | 65 | 2014 | 6.62 | 762 | 712 | 196.6 |
| D | 10 | 189 | 1832 | 6.19 | 708 | 642 | 192.1 |
| D | 7 | 3 | 1832 | 6.19 | 708 | 642 | 192.1 |
| D | 4 | 160 | 1818 | 6.12 | 708 | 642 | 192.1 |
Histogram calculated using DETX and DETY for each event in the final _common_clean file
| Quadrant A |  |
 |
Quadrant B |
|---|---|---|---|
| Quadrant D |  |
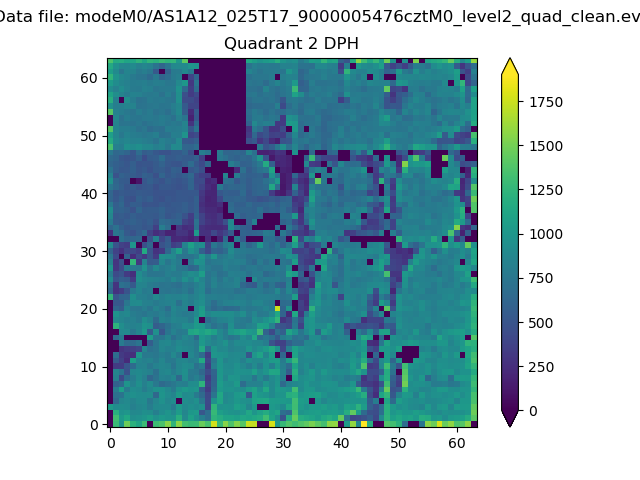 |
Quadrant C |
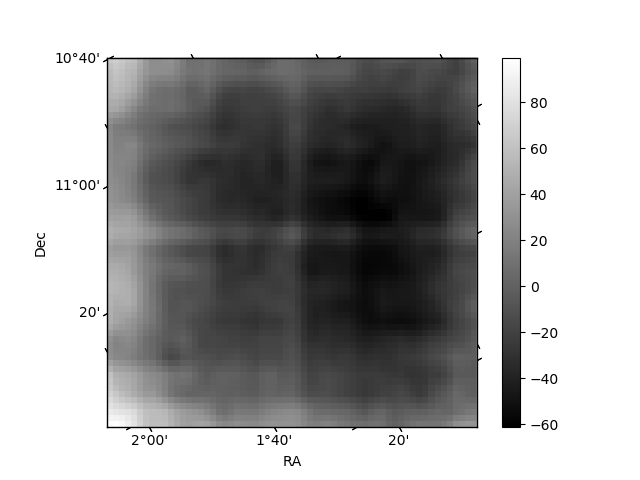
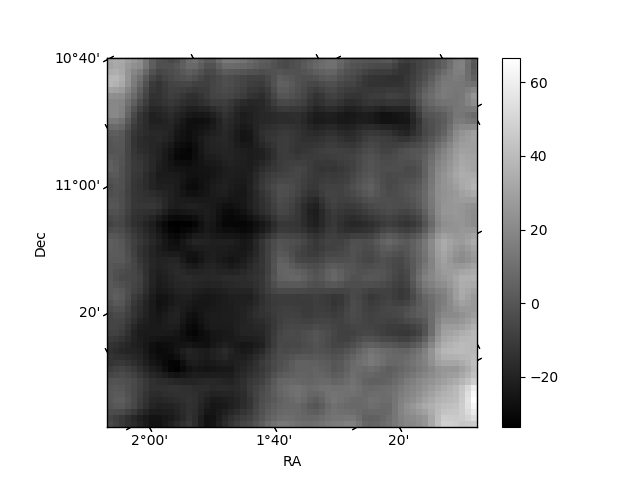
| Plot type | Count rate plots | Images |
|---|---|---|
| Comparison with Poisson distribution Blue bars denote a histogram of data divided into 1 sec bins. Red curve is a Poisson curve with rate = median count rate of data. |
 |
 |
| Quadrant-wise count rates Data is divided into 100 sec bins |
 |
|
| Module-wise count rates for Quadrant A Data is divided into 100 sec bins |
 |
 |
| Module-wise count rates for Quadrant B Data is divided into 100 sec bins |
 |
 |
| Module-wise count rates for Quadrant C Data is divided into 100 sec bins |
 |
 |
| Module-wise count rates for Quadrant D Data is divided into 100 sec bins |
 |
 |
| Parameter | Plot |
|---|---|
| CZT HV Monitor |  |
| D_VDD | 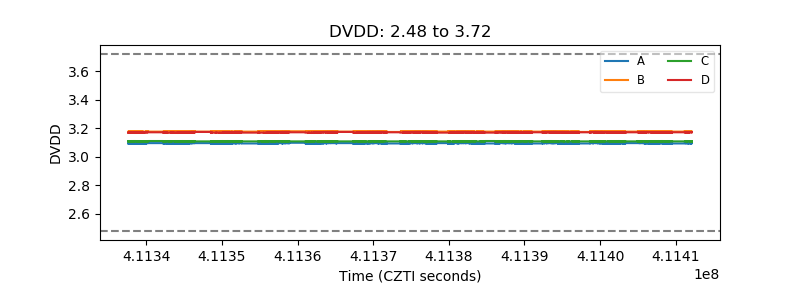 |
| Temperature 1 | 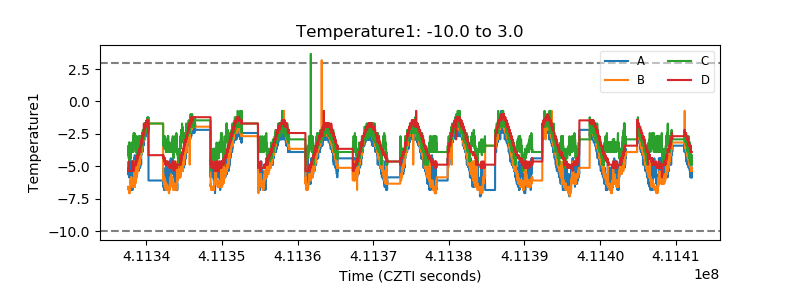 |
| Veto HV Monitor |  |
| Veto LLD |  |
| Alpha Counter |  |
| _CPM_Rate | 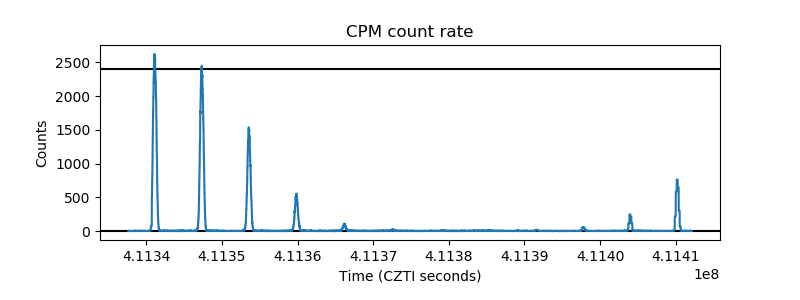 |
| CZT Counter |  |
| +2.5 Volts monitor |  |
| +5 Volts monitor |  |
| _ROLL_ROT |  |
| _Roll_DEC |  |
| _Roll_RA | 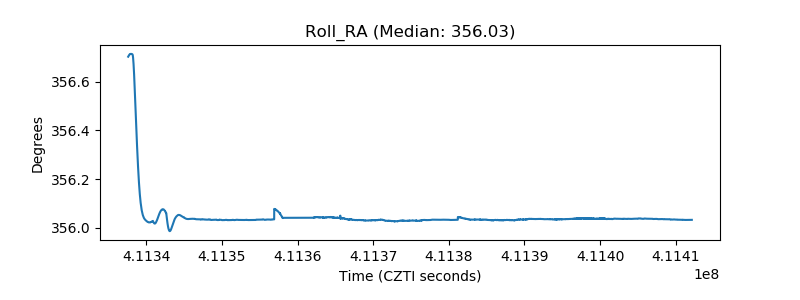 |
| Veto Counter |  |