| Param | Original file | Final file |
|---|---|---|
| Filename | modeM0/AS1A12_044T05_9000005480cztM0_level2.fits | modeM0/AS1A12_044T05_9000005480cztM0_level2_quad_clean.evt |
| Size (bytes) | 185,319,360 | 187,326,720 |
| Size | 176.7 MB | 178.6 MB |
| Events in quadrant A | 1,083,518 | 1,079,435 |
| Events in quadrant B | 1,082,450 | 1,148,980 |
| Events in quadrant C | 1,052,852 | 1,037,056 |
| Events in quadrant D | 923,436 | 939,004 |
| Mode M9 | |||
|---|---|---|---|
| Quadrant | BADHDUFLAG | Total packets | Discarded packets |
| A | 0 | 66 | 0 |
| B | 0 | 66 | 0 |
| C | 0 | 66 | 0 |
| D | 0 | 66 | 0 |
| Mode SS | |||
|---|---|---|---|
| Quadrant | BADHDUFLAG | Total packets | Discarded packets |
| A | 0 | 434 | 0 |
| B | 0 | 434 | 0 |
| C | 0 | 434 | 0 |
| D | 0 | 434 | 0 |
| Mode M0 | |||
|---|---|---|---|
| Quadrant | BADHDUFLAG | Total packets | Discarded packets |
| A | 0 | 63854 | 0 |
| B | 0 | 44100 | 0 |
| C | 0 | 65805 | 0 |
| D | 0 | 61722 | 0 |
| Quadrant | Total seconds | Saturated seconds | Saturation percentage |
|---|---|---|---|
| A | 21325 | 1437 | 6.738570% |
| B | 21325 | 85 | 0.398593% |
| C | 21325 | 1848 | 8.665885% |
| D | 21325 | 1663 | 7.798359% |
Noise dominated data is calculated using 1-second bins in cleaned event files. If a bin has >2000 counts, and if more than 50% of those come from <1% of pixels, then it is considered to be noise-dominated and hence unusable.
| Quadrant | # 1 sec bins | Bins with >0 counts | Bins with >2000 counts | High rate bins dominated by noise | Noise dominated (total time) | Noise dominated (detector-on time) | Marked lightcurve |
|---|---|---|---|---|---|---|---|
| A | 27355 | 21324 | 0 | 0 | 0.00% | 0.00% | 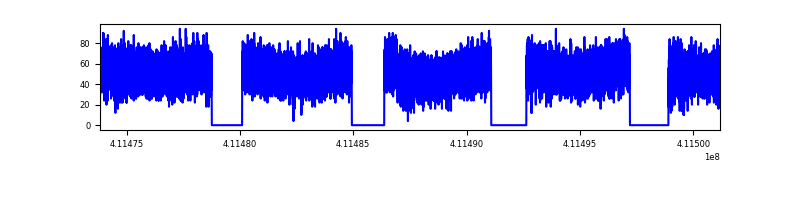 |
| B | 27355 | 21324 | 0 | 0 | 0.00% | 0.00% |  |
| C | 27355 | 21318 | 0 | 0 | 0.00% | 0.00% | 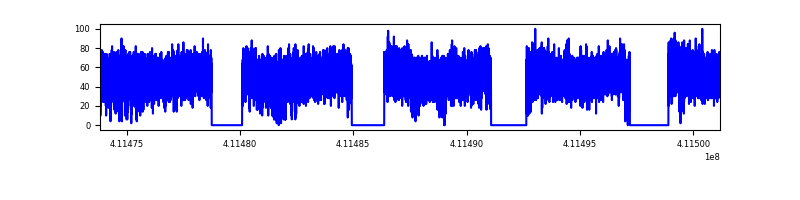 |
| D | 27355 | 21308 | 0 | 0 | 0.00% | 0.00% |  |
Top three noisy pixels from each quadrant. If the there are fewer than three noisy pixels in the level2.evt file, extra rows are filled as -1
| Pixel properties | Quadrant properties | ||||||
|---|---|---|---|---|---|---|---|
| Quadrant | DetID | PixID | Counts | Sigma | Mean | Median | Sigma |
| A | 9 | 19 | 892 | 8.44 | 283 | 264 | 74.4 |
| A | 7 | 110 | 891 | 8.43 | 283 | 264 | 74.4 |
| A | 14 | 95 | 859 | 8.0 | 283 | 264 | 74.4 |
| B | 2 | 9 | 958 | 11.75 | 285 | 271 | 58.5 |
| B | 3 | 80 | 843 | 9.79 | 285 | 271 | 58.5 |
| B | 3 | 17 | 774 | 8.6 | 285 | 271 | 58.5 |
| C | 1 | 81 | 872 | 8.41 | 278 | 260 | 72.8 |
| C | 1 | 80 | 852 | 8.14 | 278 | 260 | 72.8 |
| C | 3 | 203 | 850 | 8.11 | 278 | 260 | 72.8 |
| D | 7 | 3 | 682 | 6.17 | 263 | 238 | 71.9 |
| D | 4 | 160 | 670 | 6.01 | 263 | 238 | 71.9 |
| D | 10 | 189 | 668 | 5.98 | 263 | 238 | 71.9 |
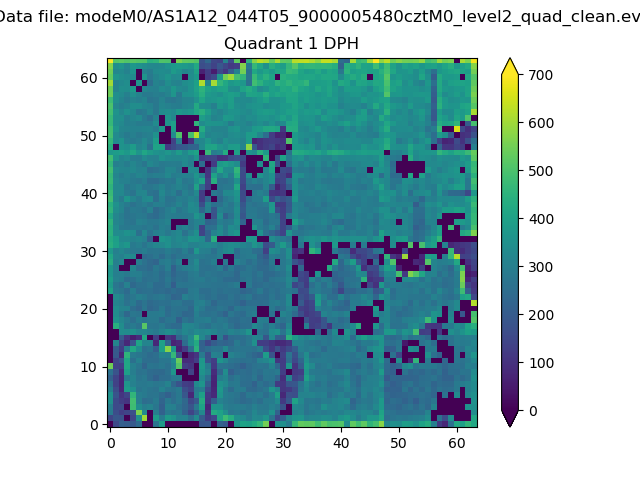
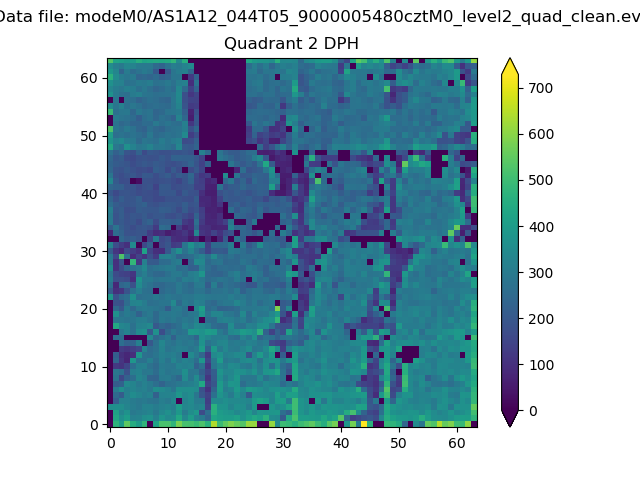
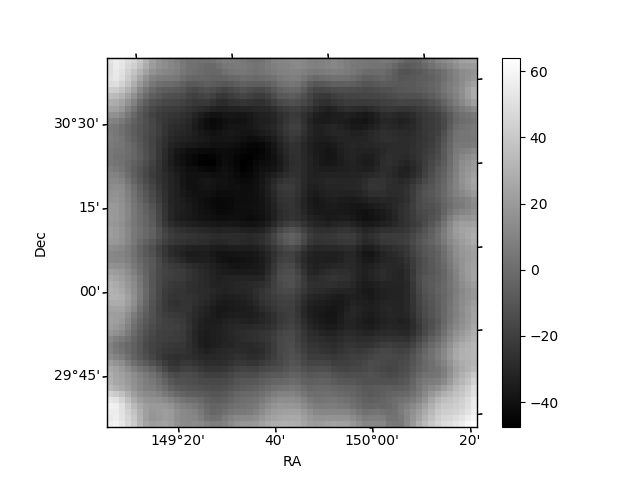
Histogram calculated using DETX and DETY for each event in the final _common_clean file
| Quadrant A |  |
 |
Quadrant B |
|---|---|---|---|
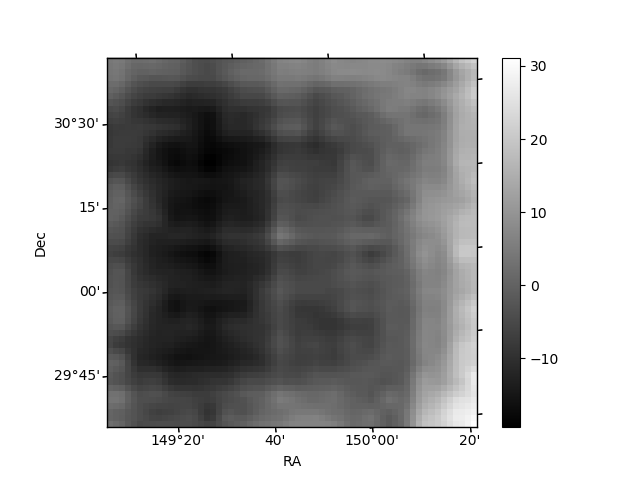
| Quadrant D |  |
 |
Quadrant C |
| Plot type | Count rate plots | Images |
|---|---|---|
| Comparison with Poisson distribution Blue bars denote a histogram of data divided into 1 sec bins. Red curve is a Poisson curve with rate = median count rate of data. |
 |
 |
| Quadrant-wise count rates Data is divided into 100 sec bins |
 |
|
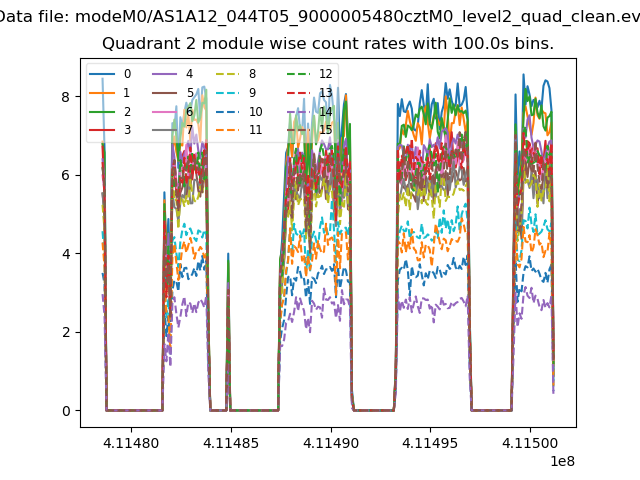
| Module-wise count rates for Quadrant A Data is divided into 100 sec bins |
 |
 |
| Module-wise count rates for Quadrant B Data is divided into 100 sec bins |
 |
 |
| Module-wise count rates for Quadrant C Data is divided into 100 sec bins |
 |
 |
| Module-wise count rates for Quadrant D Data is divided into 100 sec bins |
 |
 |
| Parameter | Plot |
|---|---|
| CZT HV Monitor | 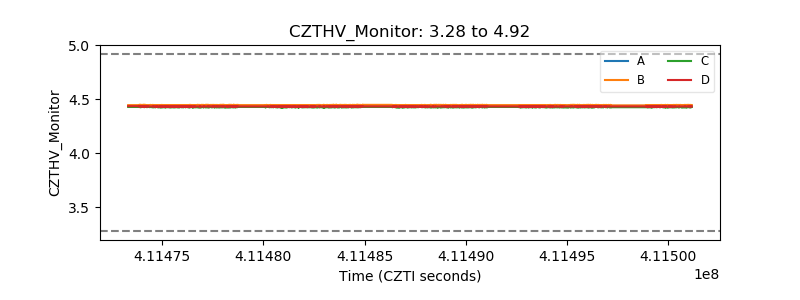 |
| D_VDD |  |
| Temperature 1 |  |
| Veto HV Monitor |  |
| Veto LLD | 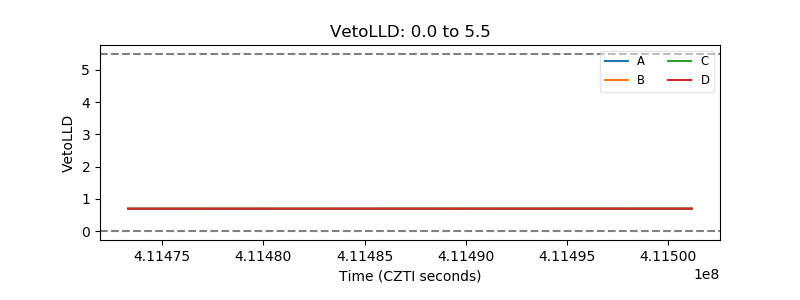 |
| Alpha Counter |  |
| _CPM_Rate |  |
| CZT Counter |  |
| +2.5 Volts monitor | 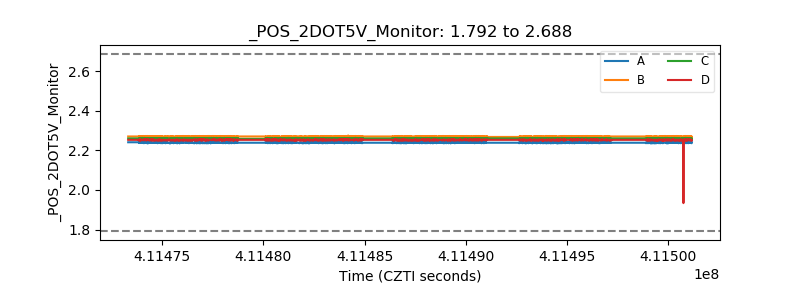 |
| +5 Volts monitor | 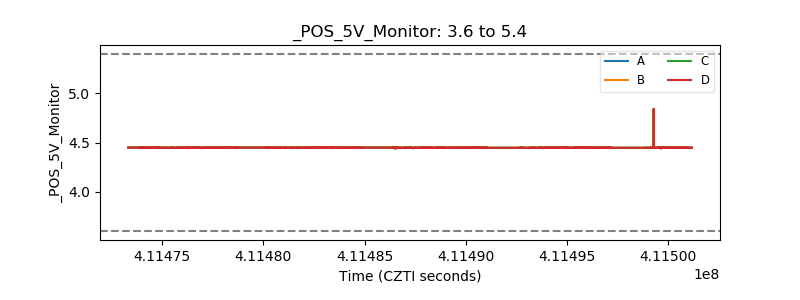 |
| _ROLL_ROT |  |
| _Roll_DEC |  |
| _Roll_RA | 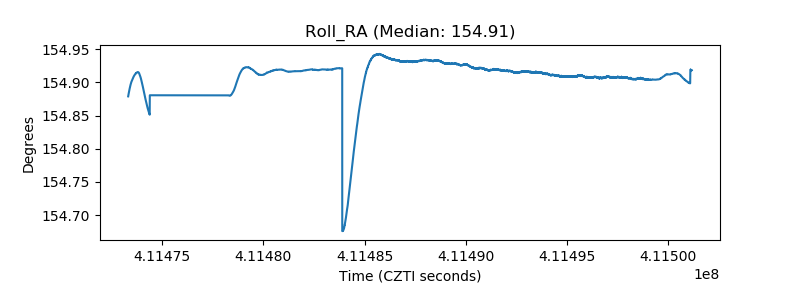 |
| Veto Counter |  |