| Param | Original file | Final file |
|---|---|---|
| Filename | modeM0/AS1A12_088T26_9000005482cztM0_level2.fits | modeM0/AS1A12_088T26_9000005482cztM0_level2_quad_clean.evt |
| Size (bytes) | 30,257,280 | 17,582,400 |
| Size | 28.9 MB | 16.8 MB |
| Events in quadrant A | 180,094 | 74,361 |
| Events in quadrant B | 176,422 | 80,561 |
| Events in quadrant C | 172,912 | 74,324 |
| Events in quadrant D | 155,504 | 70,512 |
| Mode SS | |||
|---|---|---|---|
| Quadrant | BADHDUFLAG | Total packets | Discarded packets |
| A | 0 | 68 | 0 |
| B | 0 | 68 | 0 |
| C | 0 | 68 | 0 |
| D | 0 | 68 | 0 |
| Mode M9 | |||
|---|---|---|---|
| Quadrant | BADHDUFLAG | Total packets | Discarded packets |
| A | 0 | 18 | 0 |
| B | 0 | 18 | 0 |
| C | 0 | 18 | 0 |
| D | 0 | 18 | 0 |
| Mode M0 | |||
|---|---|---|---|
| Quadrant | BADHDUFLAG | Total packets | Discarded packets |
| A | 0 | 9197 | 0 |
| B | 0 | 7329 | 0 |
| C | 0 | 10778 | 0 |
| D | 0 | 8386 | 0 |
| Quadrant | Total seconds | Saturated seconds | Saturation percentage |
|---|---|---|---|
| A | 3256 | 83 | 2.549140% |
| B | 3256 | 74 | 2.272727% |
| C | 3256 | 248 | 7.616708% |
| D | 3256 | 81 | 2.487715% |
Noise dominated data is calculated using 1-second bins in cleaned event files. If a bin has >2000 counts, and if more than 50% of those come from <1% of pixels, then it is considered to be noise-dominated and hence unusable.
| Quadrant | # 1 sec bins | Bins with >0 counts | Bins with >2000 counts | High rate bins dominated by noise | Noise dominated (total time) | Noise dominated (detector-on time) | Marked lightcurve |
|---|---|---|---|---|---|---|---|
| A | 5078 | 3257 | 0 | 0 | 0.00% | 0.00% | 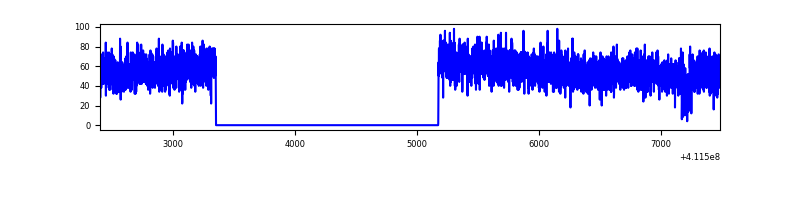 |
| B | 5078 | 3251 | 0 | 0 | 0.00% | 0.00% | 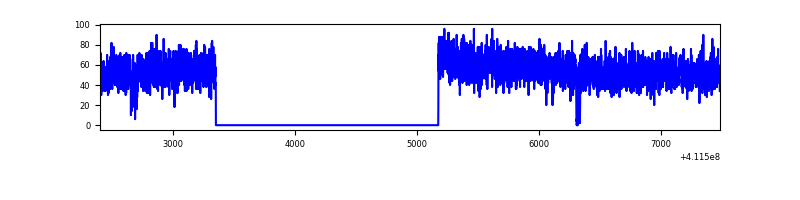 |
| C | 5078 | 3256 | 0 | 0 | 0.00% | 0.00% |  |
| D | 5078 | 3251 | 0 | 0 | 0.00% | 0.00% |  |
Top three noisy pixels from each quadrant. If the there are fewer than three noisy pixels in the level2.evt file, extra rows are filled as -1
| Pixel properties | Quadrant properties | ||||||
|---|---|---|---|---|---|---|---|
| Quadrant | DetID | PixID | Counts | Sigma | Mean | Median | Sigma |
| A | 15 | 236 | 155 | 8.26 | 47 | 44 | 13.4 |
| A | 0 | 29 | 152 | 8.04 | 47 | 44 | 13.4 |
| A | 9 | 19 | 144 | 7.45 | 47 | 44 | 13.4 |
| B | 3 | 80 | 146 | 8.92 | 46 | 44 | 11.4 |
| B | 2 | 9 | 146 | 8.92 | 46 | 44 | 11.4 |
| B | 5 | 128 | 128 | 7.35 | 46 | 44 | 11.4 |
| C | 1 | 81 | 151 | 8.14 | 45 | 43 | 13.3 |
| C | 1 | 65 | 136 | 7.01 | 45 | 43 | 13.3 |
| C | 1 | 80 | 134 | 6.86 | 45 | 43 | 13.3 |
| D | 4 | 160 | 129 | 6.69 | 44 | 40 | 13.3 |
| D | 7 | 3 | 123 | 6.24 | 44 | 40 | 13.3 |
| D | 1 | 31 | 115 | 5.64 | 44 | 40 | 13.3 |
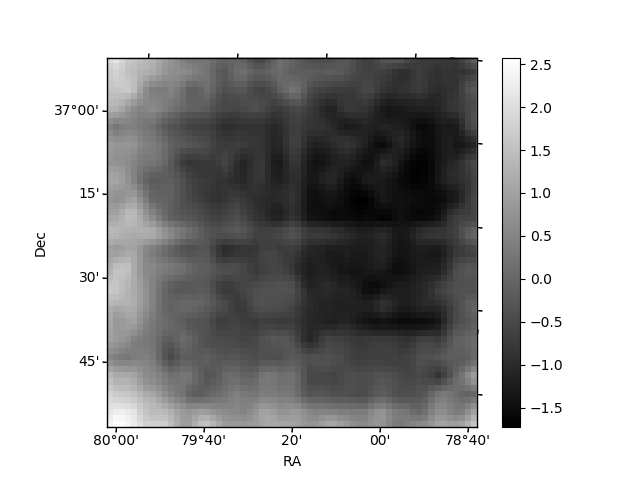
Histogram calculated using DETX and DETY for each event in the final _common_clean file
| Quadrant A | 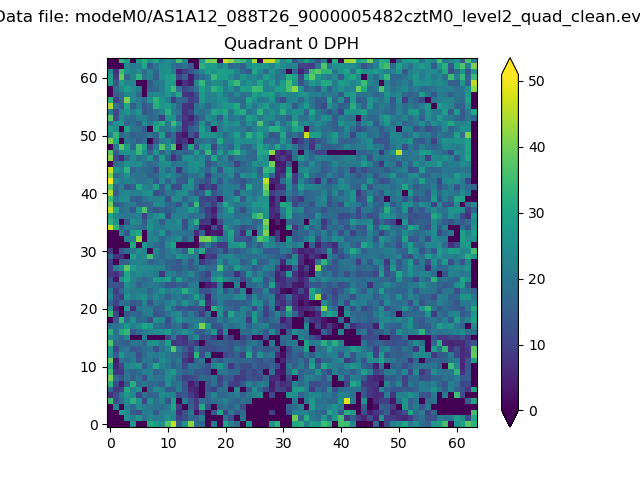 |
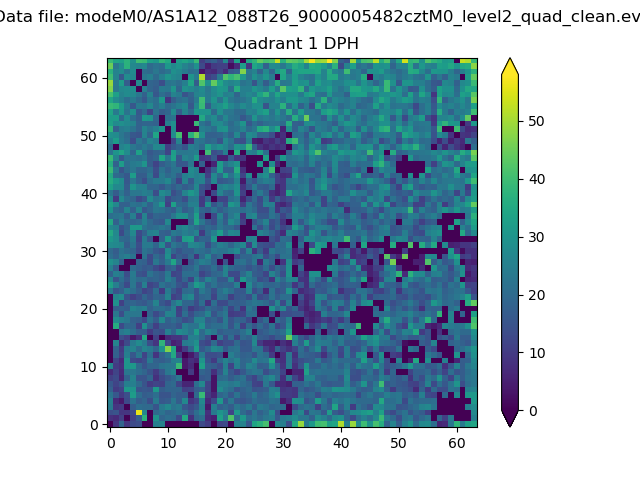 |
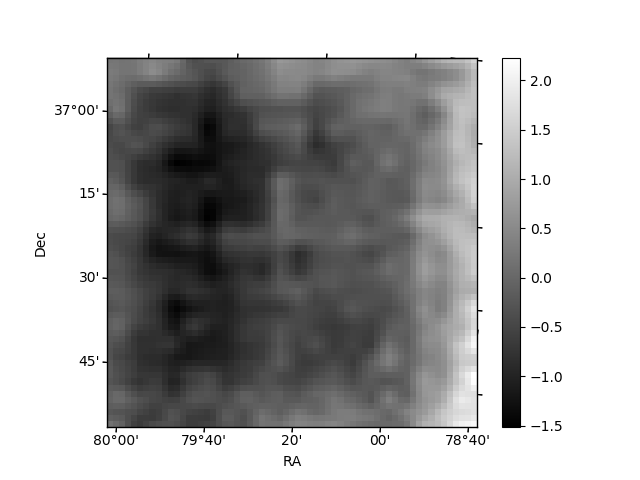
Quadrant B |
|---|---|---|---|
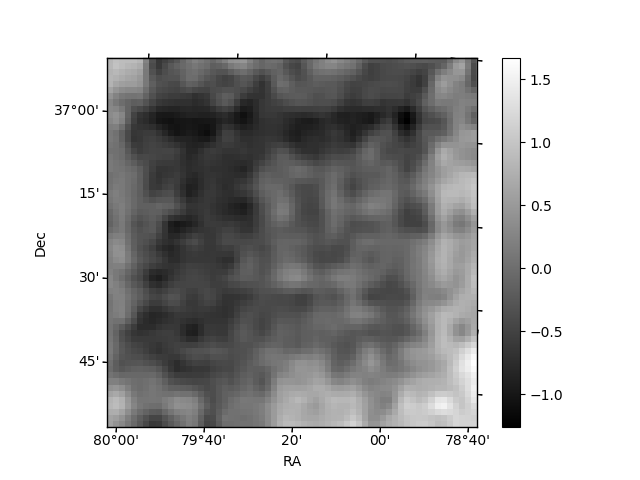
| Quadrant D | 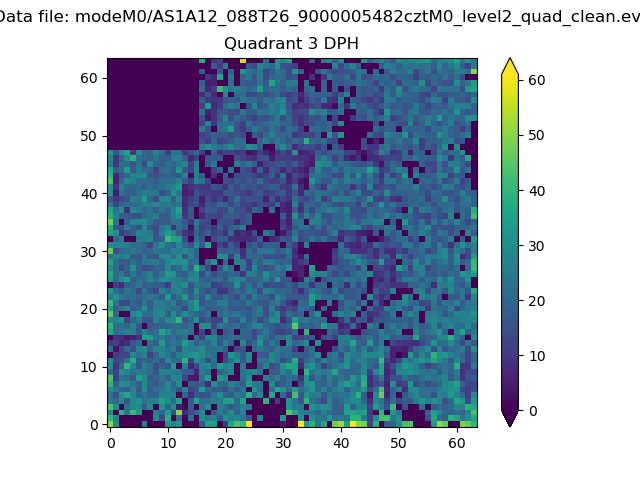 |
 |
Quadrant C |
| Plot type | Count rate plots | Images |
|---|---|---|
| Comparison with Poisson distribution Blue bars denote a histogram of data divided into 1 sec bins. Red curve is a Poisson curve with rate = median count rate of data. |
 |
 |
| Quadrant-wise count rates Data is divided into 100 sec bins |
 |
|
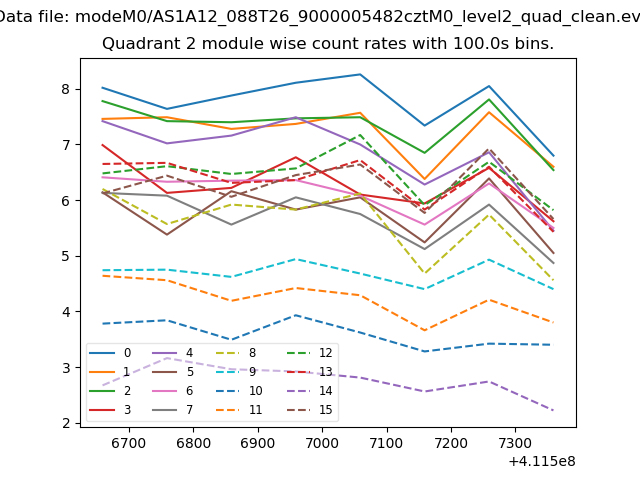
| Module-wise count rates for Quadrant A Data is divided into 100 sec bins |
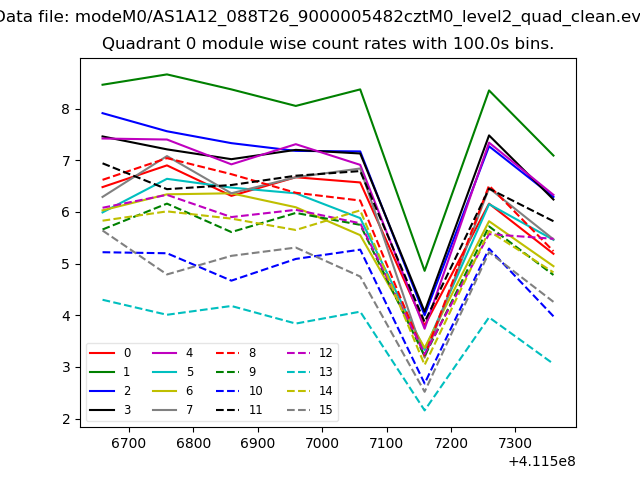 |
 |
| Module-wise count rates for Quadrant B Data is divided into 100 sec bins |
 |
 |
| Module-wise count rates for Quadrant C Data is divided into 100 sec bins |
 |
 |
| Module-wise count rates for Quadrant D Data is divided into 100 sec bins |
 |
 |
| Parameter | Plot |
|---|---|
| CZT HV Monitor | 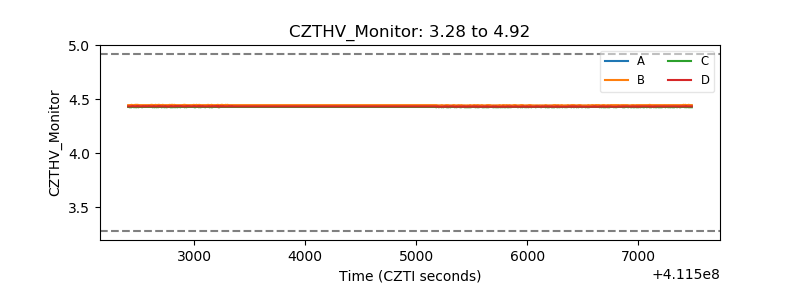 |
| D_VDD | 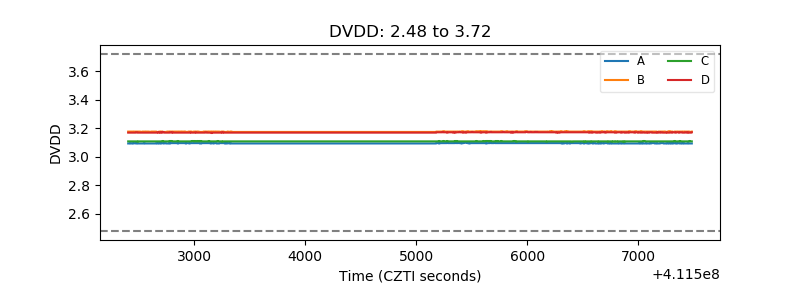 |
| Temperature 1 | 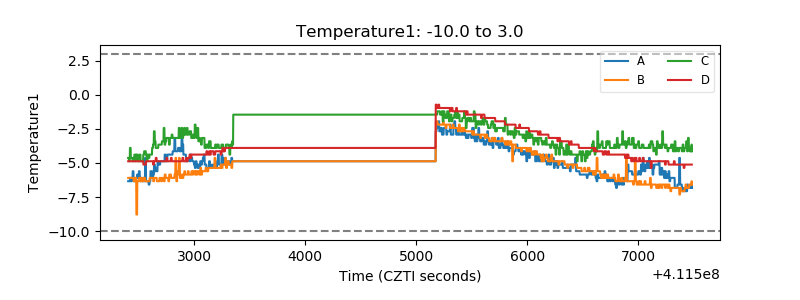 |
| Veto HV Monitor | 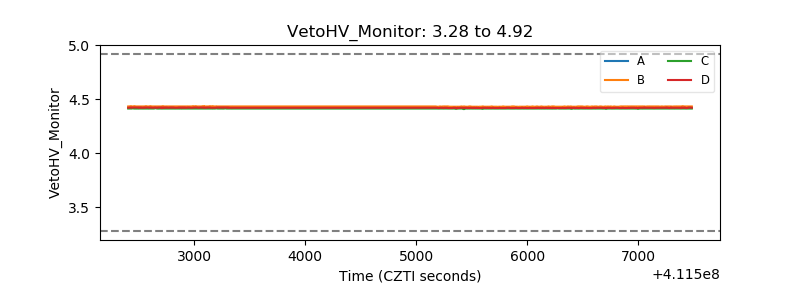 |
| Veto LLD | 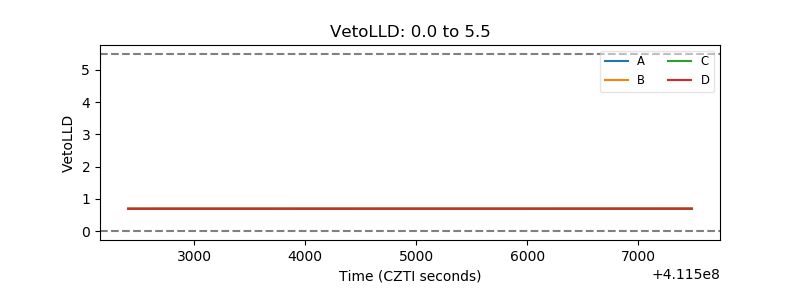 |
| Alpha Counter |  |
| _CPM_Rate |  |
| CZT Counter | 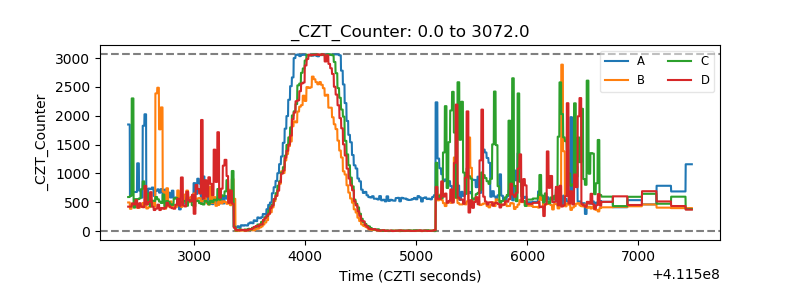 |
| +2.5 Volts monitor | 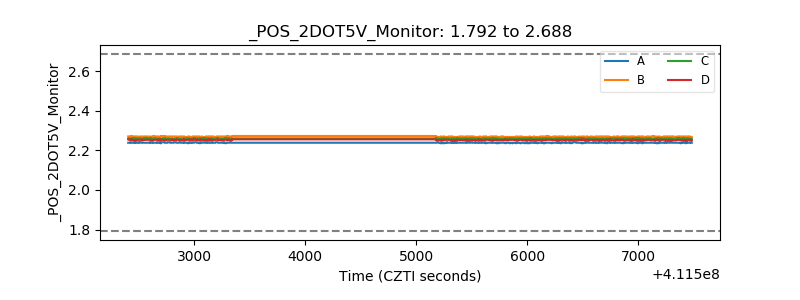 |
| +5 Volts monitor | 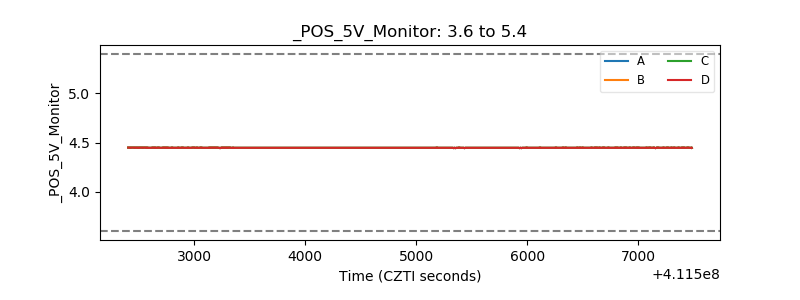 |
| _ROLL_ROT | 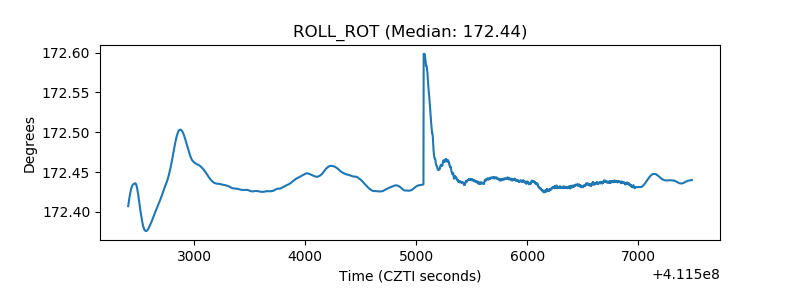 |
| _Roll_DEC | 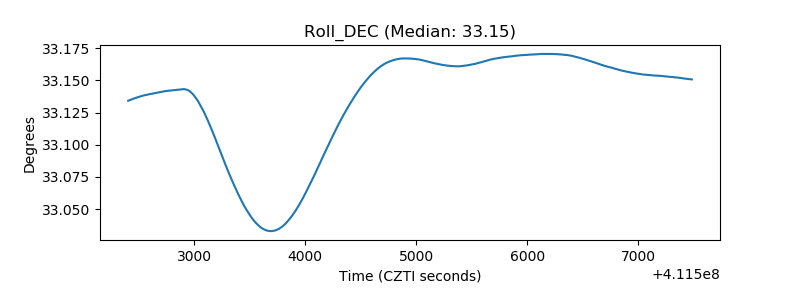 |
| _Roll_RA | 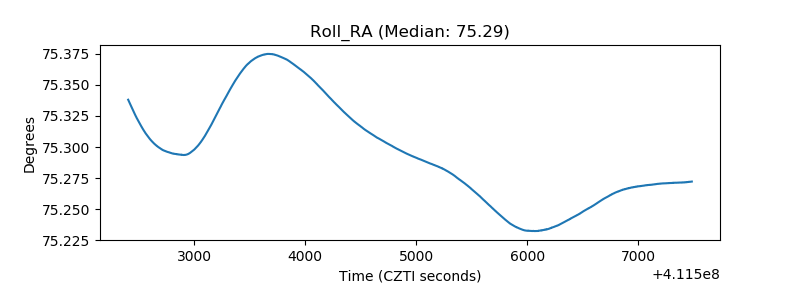 |
| Veto Counter |  |