| Param | Original file | Final file |
|---|---|---|
| Filename | modeM0/AS1C06_010T05_9000005484cztM0_level2.fits | modeM0/AS1C06_010T05_9000005484cztM0_level2_quad_clean.evt |
| Size (bytes) | 124,384,320 | 177,937,920 |
| Size | 118.6 MB | 169.7 MB |
| Events in quadrant A | 754,474 | 1,175,893 |
| Events in quadrant B | 742,362 | 1,221,144 |
| Events in quadrant C | 715,000 | 1,103,537 |
| Events in quadrant D | 605,346 | 939,432 |
| Mode M0 | |||
|---|---|---|---|
| Quadrant | BADHDUFLAG | Total packets | Discarded packets |
| A | 0 | 32584 | 0 |
| B | 0 | 28490 | 0 |
| C | 0 | 39347 | 0 |
| D | 0 | 44770 | 0 |
| Mode SS | |||
|---|---|---|---|
| Quadrant | BADHDUFLAG | Total packets | Discarded packets |
| A | 0 | 282 | 0 |
| B | 0 | 282 | 0 |
| C | 0 | 282 | 0 |
| D | 0 | 282 | 0 |
| Mode M9 | |||
|---|---|---|---|
| Quadrant | BADHDUFLAG | Total packets | Discarded packets |
| A | 0 | 63 | 0 |
| B | 0 | 63 | 0 |
| C | 0 | 63 | 0 |
| D | 0 | 63 | 0 |
| Quadrant | Total seconds | Saturated seconds | Saturation percentage |
|---|---|---|---|
| A | 13739 | 129 | 0.938933% |
| B | 13739 | 49 | 0.356649% |
| C | 13739 | 943 | 6.863673% |
| D | 13739 | 1712 | 12.460878% |
Noise dominated data is calculated using 1-second bins in cleaned event files. If a bin has >2000 counts, and if more than 50% of those come from <1% of pixels, then it is considered to be noise-dominated and hence unusable.
| Quadrant | # 1 sec bins | Bins with >0 counts | Bins with >2000 counts | High rate bins dominated by noise | Noise dominated (total time) | Noise dominated (detector-on time) | Marked lightcurve |
|---|---|---|---|---|---|---|---|
| A | 19839 | 13739 | 0 | 0 | 0.00% | 0.00% |  |
| B | 19839 | 13739 | 0 | 0 | 0.00% | 0.00% |  |
| C | 19839 | 13724 | 0 | 0 | 0.00% | 0.00% | 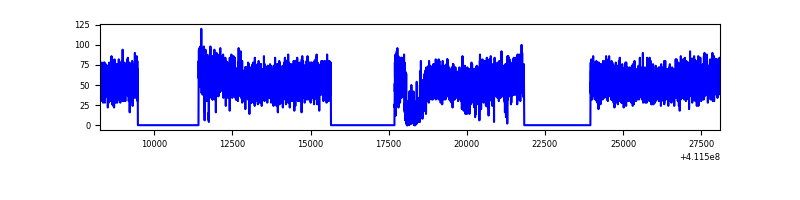 |
| D | 19839 | 13717 | 0 | 0 | 0.00% | 0.00% | 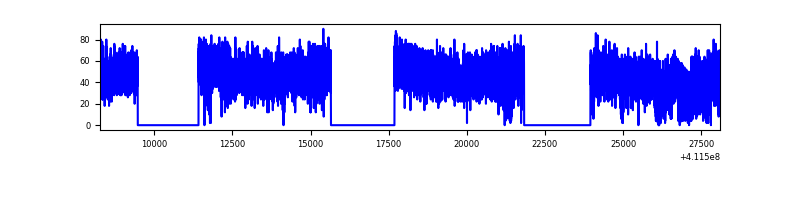 |
Top three noisy pixels from each quadrant. If the there are fewer than three noisy pixels in the level2.evt file, extra rows are filled as -1
| Pixel properties | Quadrant properties | ||||||
|---|---|---|---|---|---|---|---|
| Quadrant | DetID | PixID | Counts | Sigma | Mean | Median | Sigma |
| A | 7 | 110 | 656 | 9.28 | 197 | 186 | 50.7 |
| A | 9 | 19 | 637 | 8.9 | 197 | 186 | 50.7 |
| A | 0 | 29 | 618 | 8.53 | 197 | 186 | 50.7 |
| B | 2 | 9 | 624 | 11.15 | 196 | 189 | 39.0 |
| B | 3 | 80 | 598 | 10.48 | 196 | 189 | 39.0 |
| B | 5 | 128 | 527 | 8.66 | 196 | 189 | 39.0 |
| C | 1 | 81 | 600 | 8.37 | 189 | 179 | 50.3 |
| C | 1 | 80 | 533 | 7.03 | 189 | 179 | 50.3 |
| C | 3 | 187 | 520 | 6.78 | 189 | 179 | 50.3 |
| D | 7 | 3 | 452 | 6.21 | 173 | 158 | 47.4 |
| D | 6 | 38 | 445 | 6.06 | 173 | 158 | 47.4 |
| D | 6 | 231 | 444 | 6.04 | 173 | 158 | 47.4 |
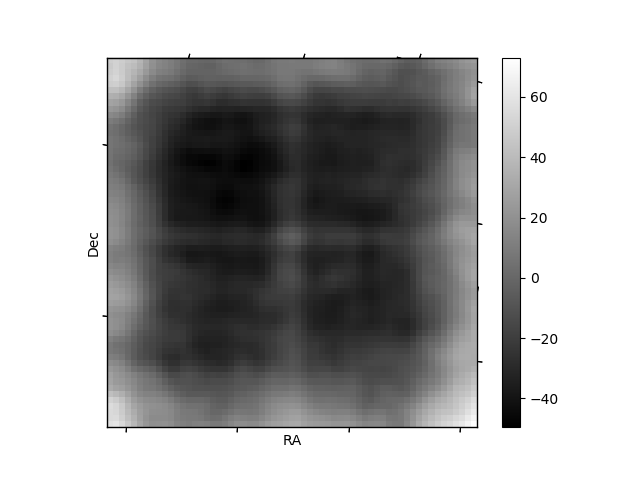
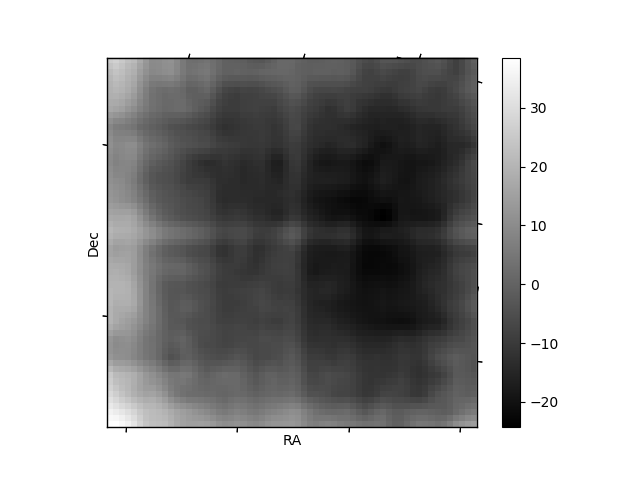
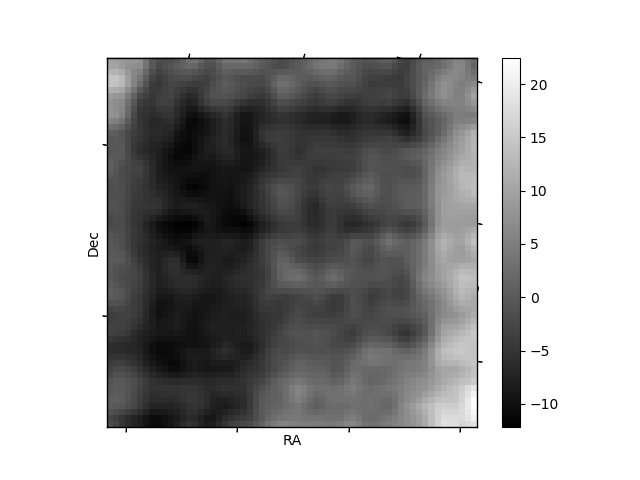
Histogram calculated using DETX and DETY for each event in the final _common_clean file
| Quadrant A |  |
 |
Quadrant B |
|---|---|---|---|
| Quadrant D | 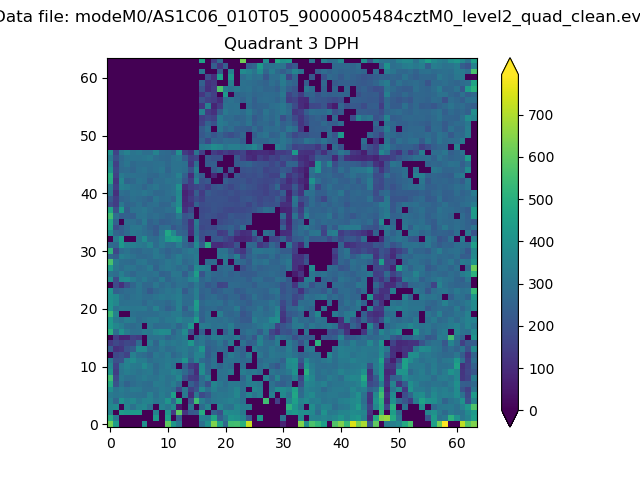 |
 |
Quadrant C |
| Plot type | Count rate plots | Images |
|---|---|---|
| Comparison with Poisson distribution Blue bars denote a histogram of data divided into 1 sec bins. Red curve is a Poisson curve with rate = median count rate of data. |
 |
 |
| Quadrant-wise count rates Data is divided into 100 sec bins |
 |
|
| Module-wise count rates for Quadrant A Data is divided into 100 sec bins |
 |
 |
| Module-wise count rates for Quadrant B Data is divided into 100 sec bins |
 |
 |
| Module-wise count rates for Quadrant C Data is divided into 100 sec bins |
 |
 |
| Module-wise count rates for Quadrant D Data is divided into 100 sec bins |
 |
 |
| Parameter | Plot |
|---|---|
| CZT HV Monitor |  |
| D_VDD |  |
| Temperature 1 | 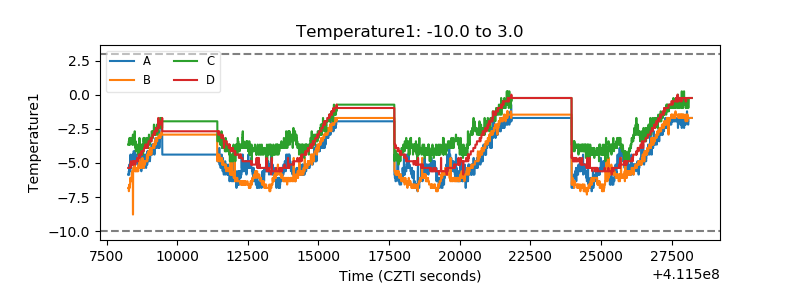 |
| Veto HV Monitor |  |
| Veto LLD |  |
| Alpha Counter |  |
| _CPM_Rate | 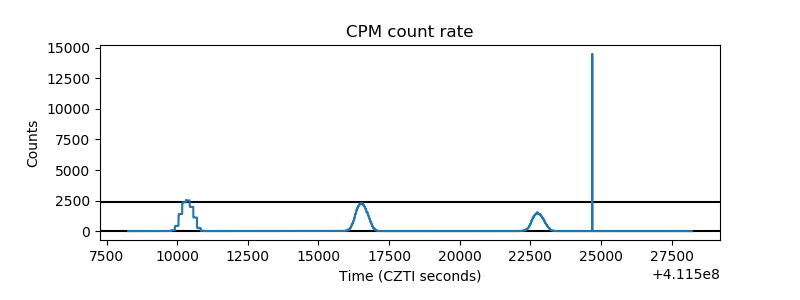 |
| CZT Counter |  |
| +2.5 Volts monitor |  |
| +5 Volts monitor |  |
| _ROLL_ROT | 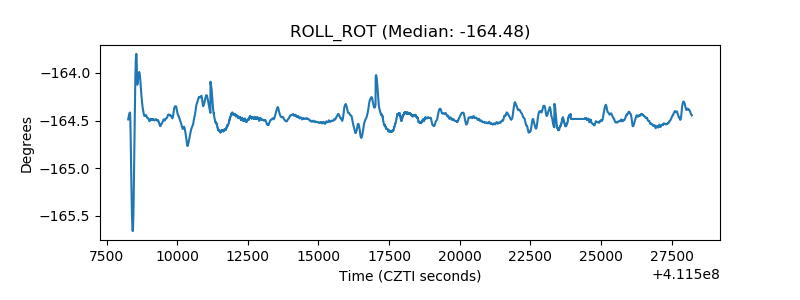 |
| _Roll_DEC | 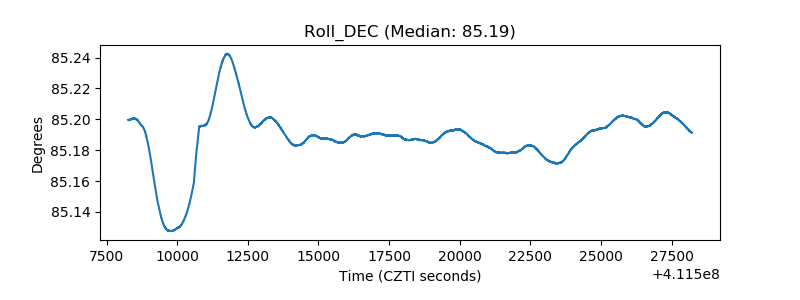 |
| _Roll_RA | 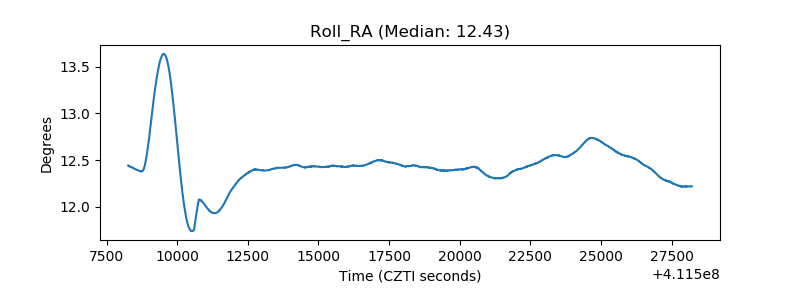 |
| Veto Counter |  |