| Param | Original file | Final file |
|---|---|---|
| Filename | modeM0/AS1A12_018T01_9000005488cztM0_level2.fits | modeM0/AS1A12_018T01_9000005488cztM0_level2_quad_clean.evt |
| Size (bytes) | 4,088,217,600 | 5,390,340,480 |
| Size | 3.8 GB | 5.0 GB |
| Events in quadrant A | 20,791,196 | 30,998,955 |
| Events in quadrant B | 20,412,478 | 32,123,186 |
| Events in quadrant C | 19,491,322 | 27,696,196 |
| Events in quadrant D | 17,568,738 | 26,957,716 |
| Mode SS | |||
|---|---|---|---|
| Quadrant | BADHDUFLAG | Total packets | Discarded packets |
| A | 0 | 13636 | 0 |
| B | 0 | 13636 | 0 |
| C | 0 | 13636 | 0 |
| D | 0 | 13636 | 0 |
| Mode M0 | |||
|---|---|---|---|
| Quadrant | BADHDUFLAG | Total packets | Discarded packets |
| A | 0 | 1742971 | 0 |
| B | 0 | 1419701 | 0 |
| C | 0 | 2375153 | 0 |
| D | 0 | 1841461 | 0 |
| Mode M9 | |||
|---|---|---|---|
| Quadrant | BADHDUFLAG | Total packets | Discarded packets |
| A | 0 | 2502 | 0 |
| B | 0 | 2502 | 0 |
| C | 0 | 2502 | 0 |
| D | 0 | 2505 | 0 |
| Quadrant | Total seconds | Saturated seconds | Saturation percentage |
|---|---|---|---|
| A | 663635 | 17358 | 2.615594% |
| B | 663636 | 7318 | 1.102713% |
| C | 663636 | 82097 | 12.370788% |
| D | 663638 | 36858 | 5.553932% |
Noise dominated data is calculated using 1-second bins in cleaned event files. If a bin has >2000 counts, and if more than 50% of those come from <1% of pixels, then it is considered to be noise-dominated and hence unusable.
| Quadrant | # 1 sec bins | Bins with >0 counts | Bins with >2000 counts | High rate bins dominated by noise | Noise dominated (total time) | Noise dominated (detector-on time) | Marked lightcurve |
|---|---|---|---|---|---|---|---|
| A | 557528 | 397465 | 0 | 0 | 0.00% | 0.00% | 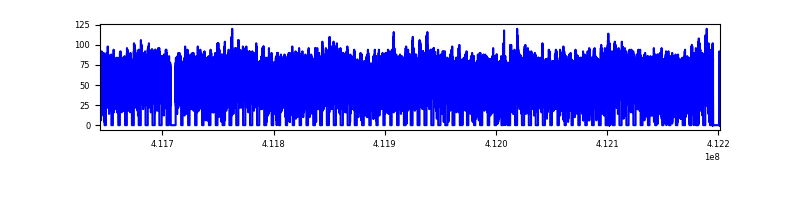 |
| B | 557528 | 397454 | 0 | 0 | 0.00% | 0.00% |  |
| C | 557528 | 396847 | 0 | 0 | 0.00% | 0.00% |  |
| D | 557528 | 396858 | 0 | 0 | 0.00% | 0.00% |  |
Top three noisy pixels from each quadrant. If the there are fewer than three noisy pixels in the level2.evt file, extra rows are filled as -1
| Pixel properties | Quadrant properties | ||||||
|---|---|---|---|---|---|---|---|
| Quadrant | DetID | PixID | Counts | Sigma | Mean | Median | Sigma |
| A | 7 | 110 | 17128 | 8.89 | 5424 | 5089 | 1354.4 |
| A | 9 | 19 | 16997 | 8.79 | 5424 | 5089 | 1354.4 |
| A | 0 | 29 | 16858 | 8.69 | 5424 | 5089 | 1354.4 |
| B | 2 | 9 | 17540 | 12.05 | 5396 | 5153 | 1028.1 |
| B | 3 | 80 | 15749 | 10.31 | 5396 | 5153 | 1028.1 |
| B | 3 | 17 | 14184 | 8.78 | 5396 | 5153 | 1028.1 |
| C | 1 | 81 | 16136 | 8.69 | 5158 | 4850 | 1299.1 |
| C | 1 | 80 | 15694 | 8.35 | 5158 | 4850 | 1299.1 |
| C | 3 | 203 | 15404 | 8.12 | 5158 | 4850 | 1299.1 |
| D | 10 | 189 | 13068 | 6.33 | 5042 | 4592 | 1339.5 |
| D | 4 | 160 | 13040 | 6.31 | 5042 | 4592 | 1339.5 |
| D | 7 | 3 | 12938 | 6.23 | 5042 | 4592 | 1339.5 |
Histogram calculated using DETX and DETY for each event in the final _common_clean file
| Quadrant A | 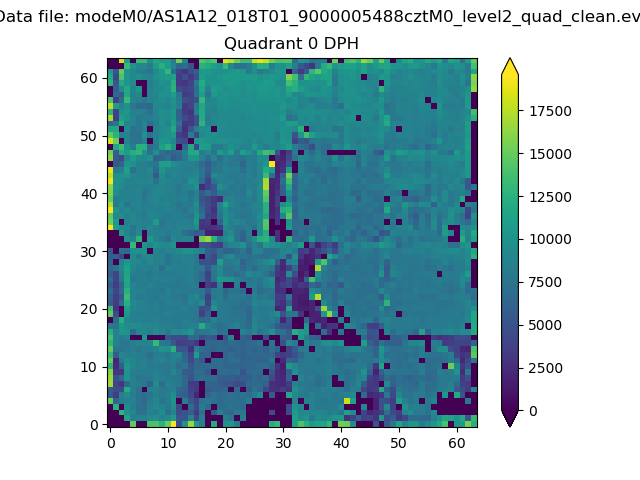 |
 |
Quadrant B |
|---|---|---|---|
| Quadrant D | 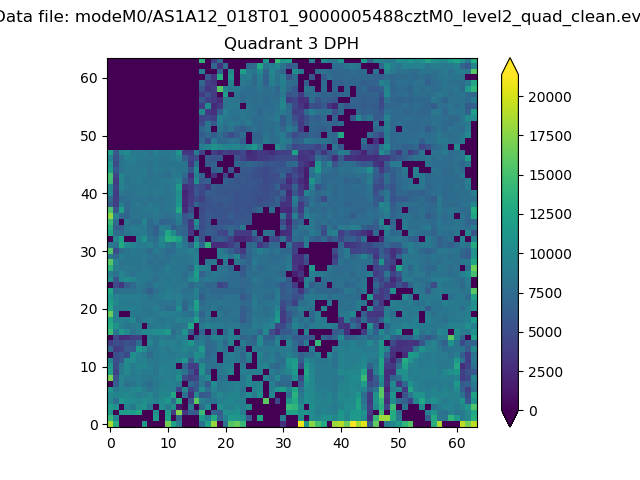 |
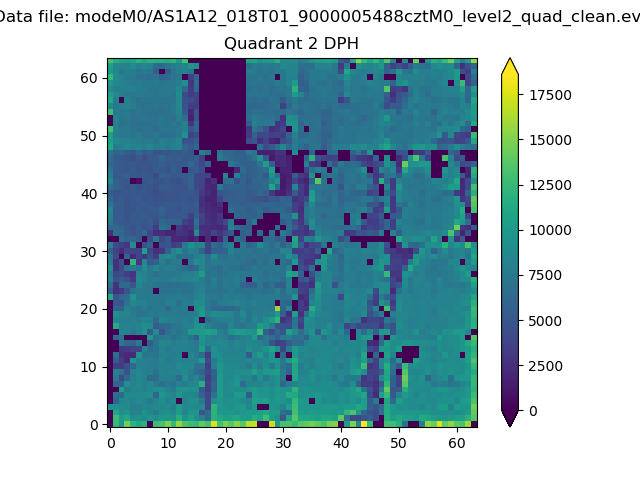 |
Quadrant C |
| Plot type | Count rate plots | Images |
|---|---|---|
| Comparison with Poisson distribution Blue bars denote a histogram of data divided into 1 sec bins. Red curve is a Poisson curve with rate = median count rate of data. |
 |
 |
| Quadrant-wise count rates Data is divided into 100 sec bins |
 |
|
| Module-wise count rates for Quadrant A Data is divided into 100 sec bins |
 |
 |
| Module-wise count rates for Quadrant B Data is divided into 100 sec bins |
 |
 |
| Module-wise count rates for Quadrant C Data is divided into 100 sec bins |
 |
 |
| Module-wise count rates for Quadrant D Data is divided into 100 sec bins |
 |
 |
| Parameter | Plot |
|---|---|
| CZT HV Monitor |  |
| D_VDD |  |
| Temperature 1 | 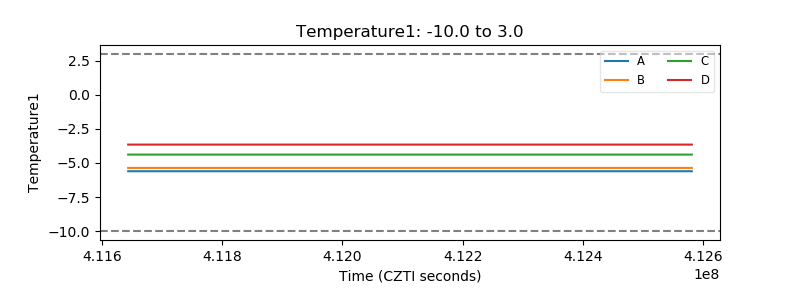 |
| Veto HV Monitor |  |
| Veto LLD | 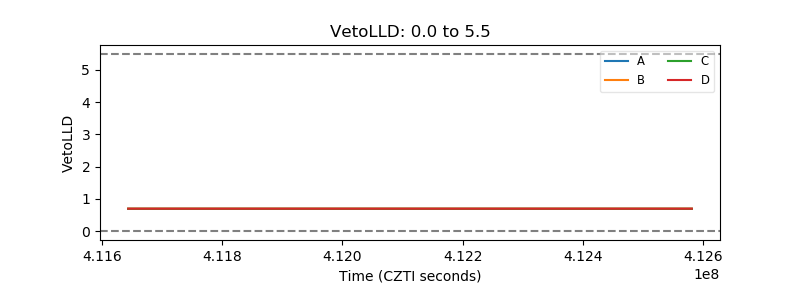 |
| Alpha Counter | 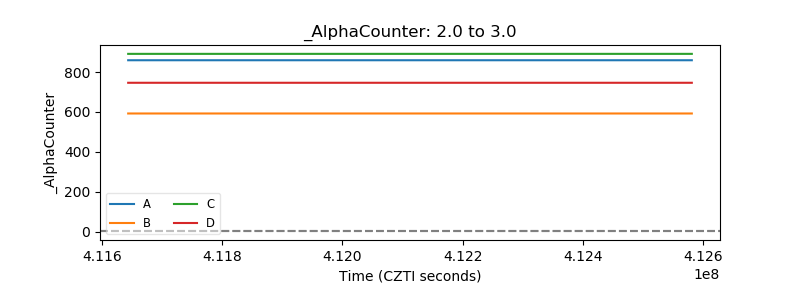 |
| _CPM_Rate |  |
| CZT Counter |  |
| +2.5 Volts monitor |  |
| +5 Volts monitor |  |
| _ROLL_ROT |  |
| _Roll_DEC |  |
| _Roll_RA |  |
| Veto Counter |  |