| Param | Original file | Final file |
|---|---|---|
| Filename | modeM0/AS1A12_011T22_9000005492cztM0_level2.fits | modeM0/AS1A12_011T22_9000005492cztM0_level2_quad_clean.evt |
| Size (bytes) | 344,882,880 | 354,798,720 |
| Size | 328.9 MB | 338.4 MB |
| Events in quadrant A | 1,895,394 | 1,879,966 |
| Events in quadrant B | 2,002,914 | 2,161,284 |
| Events in quadrant C | 2,012,444 | 2,039,513 |
| Events in quadrant D | 1,794,802 | 1,929,857 |
| Mode M0 | |||
|---|---|---|---|
| Quadrant | BADHDUFLAG | Total packets | Discarded packets |
| A | 0 | 192030 | 0 |
| B | 0 | 95074 | 0 |
| C | 0 | 123153 | 0 |
| D | 0 | 98322 | 0 |
| Mode SS | |||
|---|---|---|---|
| Quadrant | BADHDUFLAG | Total packets | Discarded packets |
| A | 0 | 812 | 0 |
| B | 0 | 812 | 0 |
| C | 0 | 812 | 0 |
| D | 0 | 812 | 0 |
| Mode M9 | |||
|---|---|---|---|
| Quadrant | BADHDUFLAG | Total packets | Discarded packets |
| A | 0 | 120 | 0 |
| B | 0 | 120 | 0 |
| C | 0 | 120 | 0 |
| D | 0 | 120 | 0 |
| Quadrant | Total seconds | Saturated seconds | Saturation percentage |
|---|---|---|---|
| A | 39805 | 8717 | 21.899259% |
| B | 39805 | 1508 | 3.788469% |
| C | 39805 | 1885 | 4.735586% |
| D | 39805 | 1268 | 3.185529% |
Noise dominated data is calculated using 1-second bins in cleaned event files. If a bin has >2000 counts, and if more than 50% of those come from <1% of pixels, then it is considered to be noise-dominated and hence unusable.
| Quadrant | # 1 sec bins | Bins with >0 counts | Bins with >2000 counts | High rate bins dominated by noise | Noise dominated (total time) | Noise dominated (detector-on time) | Marked lightcurve |
|---|---|---|---|---|---|---|---|
| A | 51802 | 39619 | 0 | 0 | 0.00% | 0.00% | 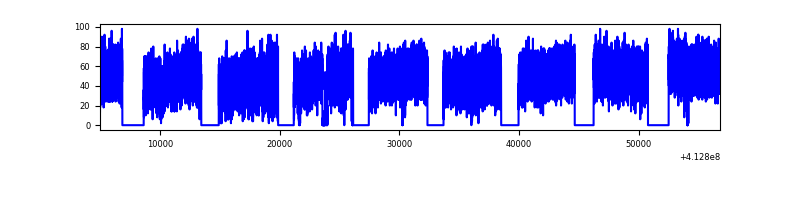 |
| B | 51802 | 39632 | 0 | 0 | 0.00% | 0.00% | 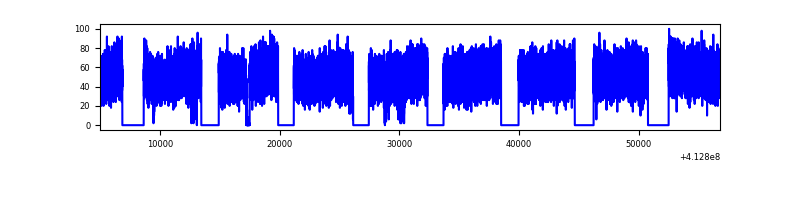 |
| C | 51802 | 39783 | 0 | 0 | 0.00% | 0.00% |  |
| D | 51802 | 39800 | 0 | 0 | 0.00% | 0.00% | 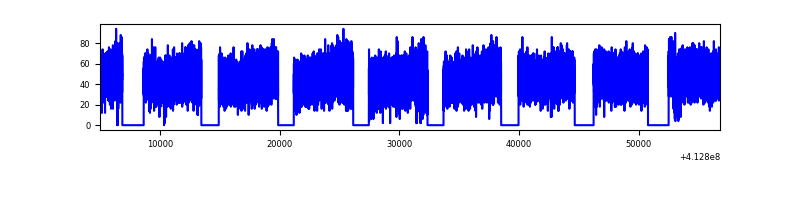 |
Top three noisy pixels from each quadrant. If the there are fewer than three noisy pixels in the level2.evt file, extra rows are filled as -1
| Pixel properties | Quadrant properties | ||||||
|---|---|---|---|---|---|---|---|
| Quadrant | DetID | PixID | Counts | Sigma | Mean | Median | Sigma |
| A | 9 | 19 | 1598 | 8.98 | 494 | 463 | 126.4 |
| A | 7 | 110 | 1542 | 8.54 | 494 | 463 | 126.4 |
| A | 0 | 29 | 1534 | 8.48 | 494 | 463 | 126.4 |
| B | 2 | 9 | 1732 | 11.69 | 529 | 503 | 105.1 |
| B | 3 | 80 | 1476 | 9.25 | 529 | 503 | 105.1 |
| B | 5 | 128 | 1444 | 8.95 | 529 | 503 | 105.1 |
| C | 1 | 81 | 1676 | 8.49 | 533 | 497 | 138.8 |
| C | 1 | 80 | 1608 | 8.0 | 533 | 497 | 138.8 |
| C | 1 | 65 | 1443 | 6.81 | 533 | 497 | 138.8 |
| D | 3 | 14 | 1331 | 6.21 | 513 | 467 | 139.1 |
| D | 7 | 3 | 1308 | 6.05 | 513 | 467 | 139.1 |
| D | 4 | 160 | 1290 | 5.92 | 513 | 467 | 139.1 |
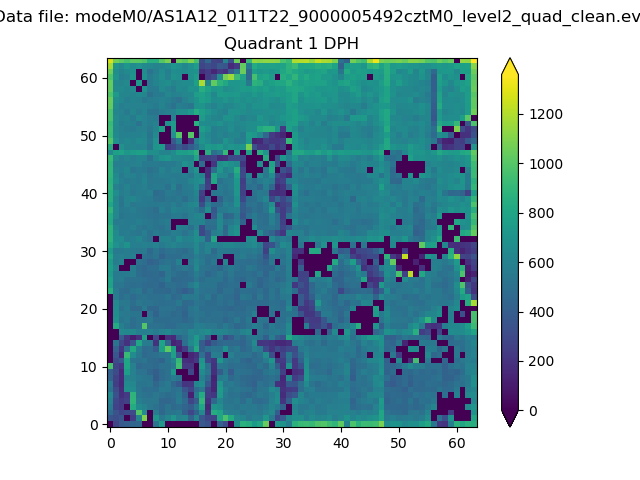
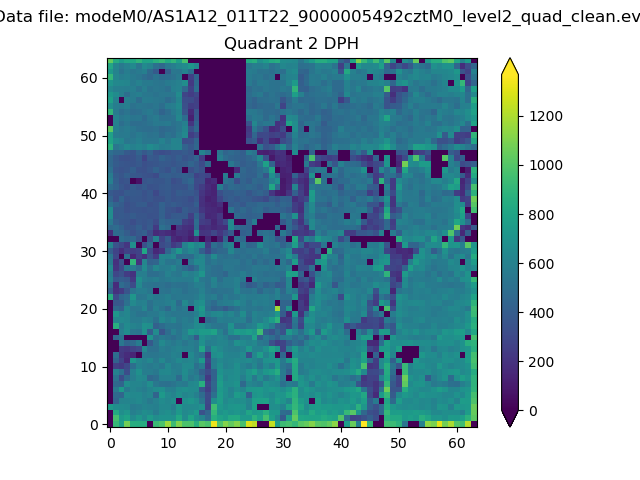
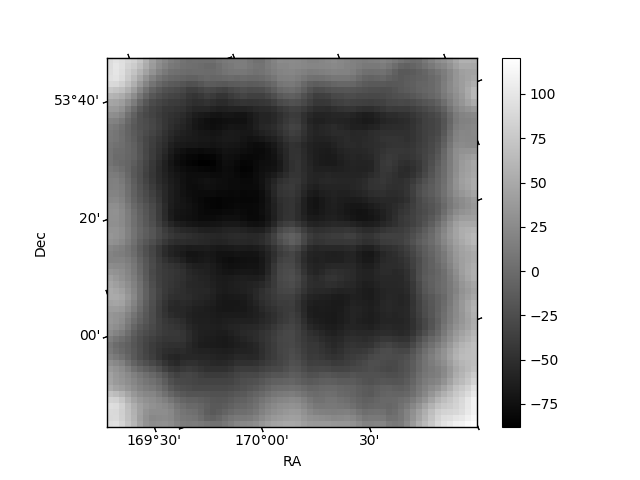
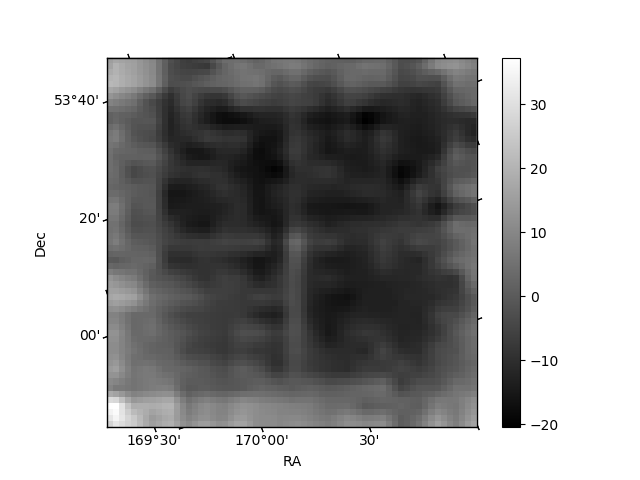
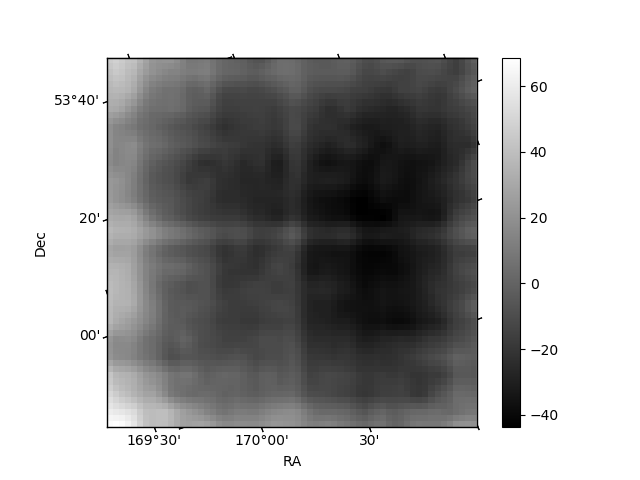
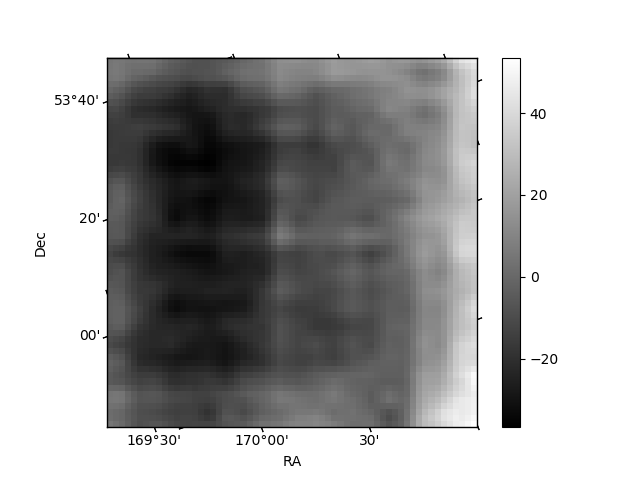
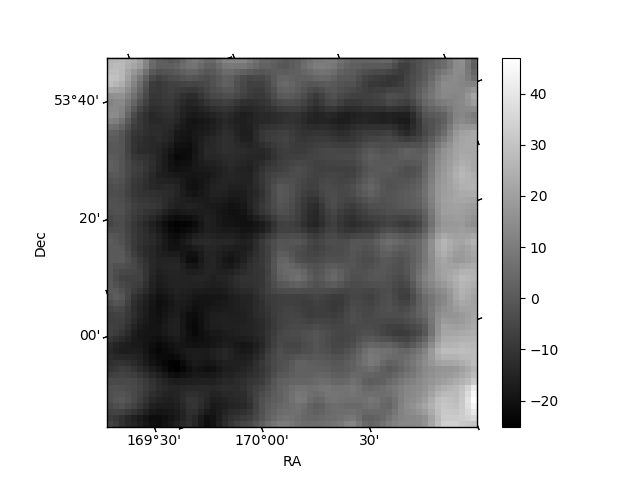
Histogram calculated using DETX and DETY for each event in the final _common_clean file
| Quadrant A | 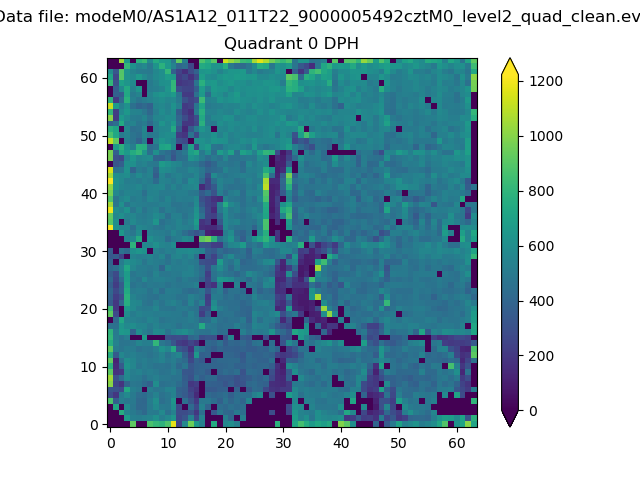 |
 |
Quadrant B |
|---|---|---|---|
| Quadrant D | 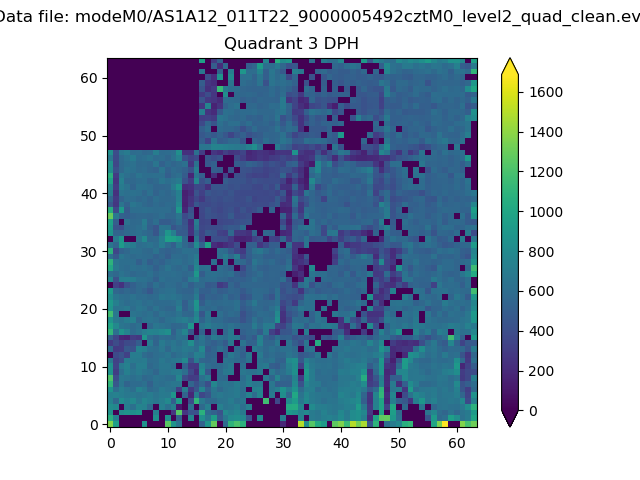 |
 |
Quadrant C |
| Plot type | Count rate plots | Images |
|---|---|---|
| Comparison with Poisson distribution Blue bars denote a histogram of data divided into 1 sec bins. Red curve is a Poisson curve with rate = median count rate of data. |
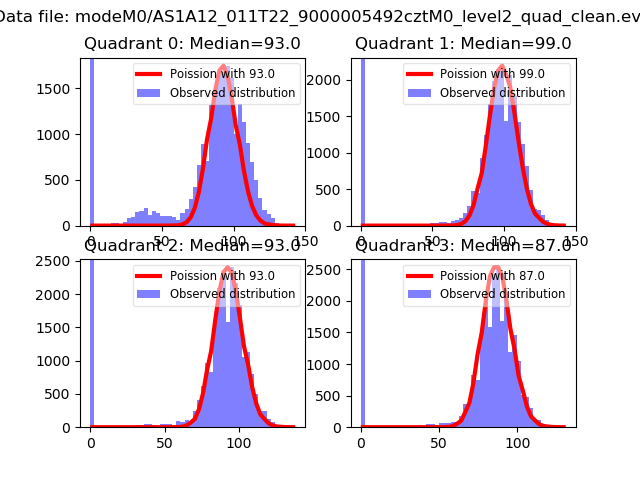 |
 |
| Quadrant-wise count rates Data is divided into 100 sec bins |
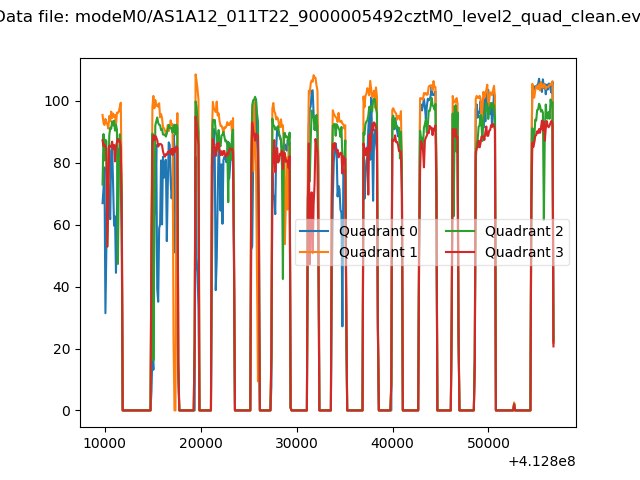 |
|
| Module-wise count rates for Quadrant A Data is divided into 100 sec bins |
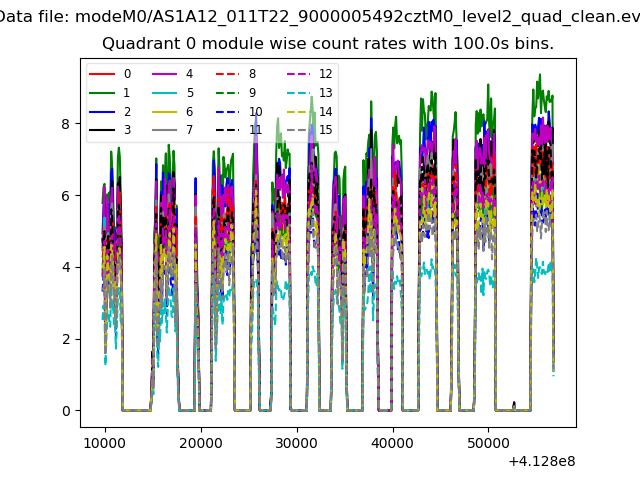 |
 |
| Module-wise count rates for Quadrant B Data is divided into 100 sec bins |
 |
 |
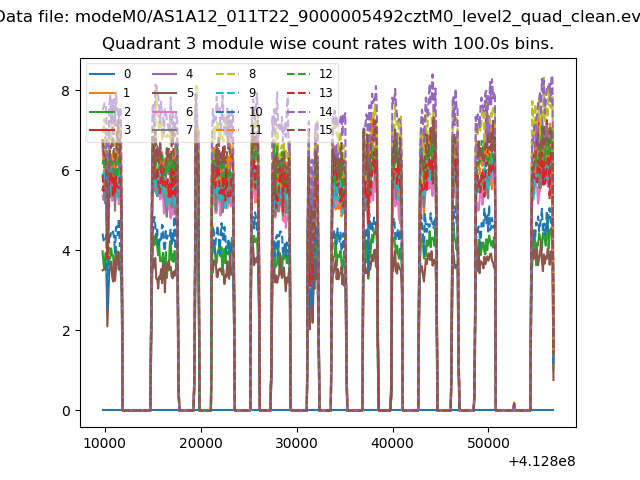
| Module-wise count rates for Quadrant C Data is divided into 100 sec bins |
 |
 |
| Module-wise count rates for Quadrant D Data is divided into 100 sec bins |
 |
 |
| Parameter | Plot |
|---|---|
| CZT HV Monitor | 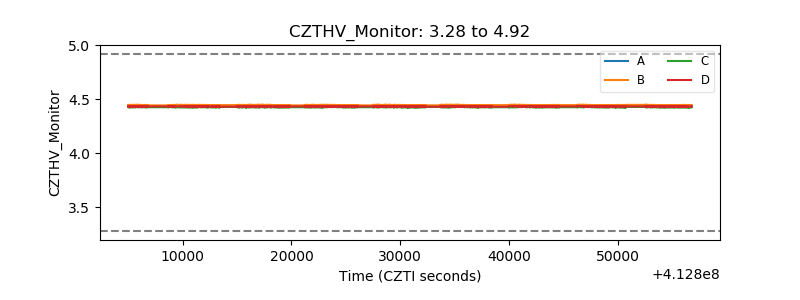 |
| D_VDD | 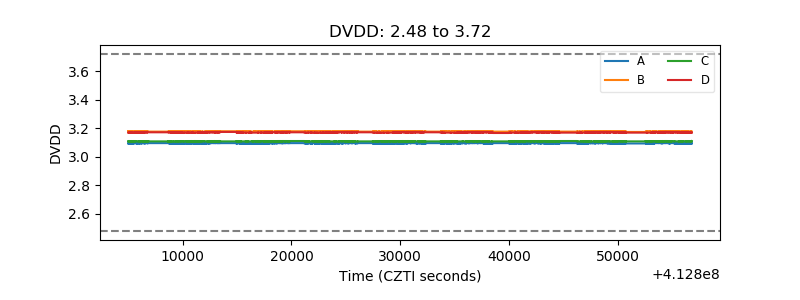 |
| Temperature 1 | 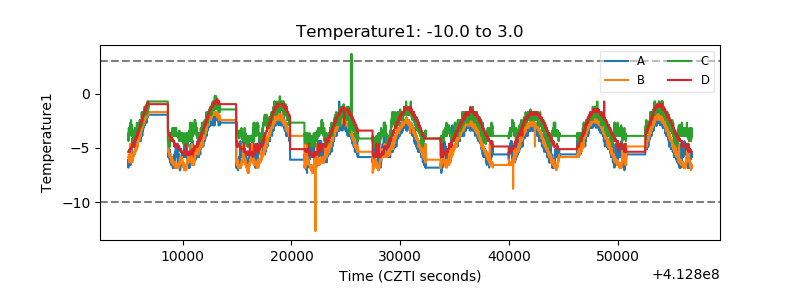 |
| Veto HV Monitor | 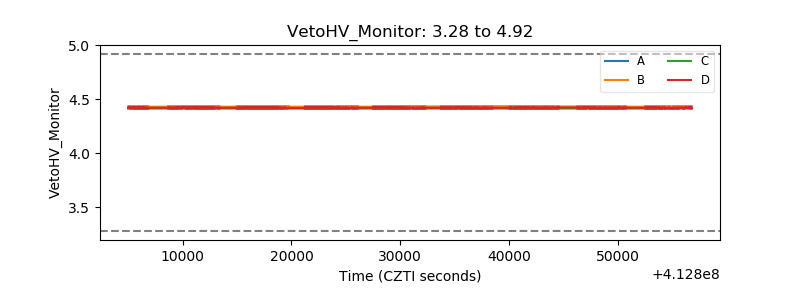 |
| Veto LLD | 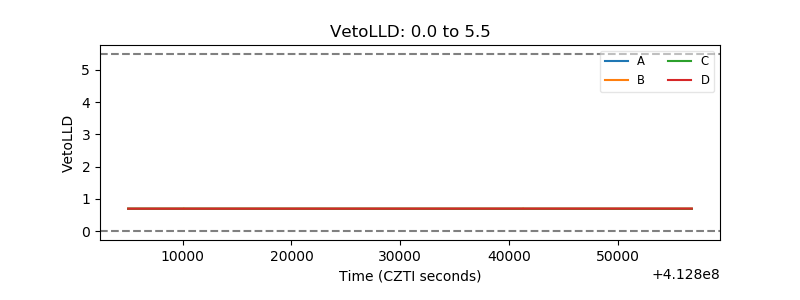 |
| Alpha Counter | 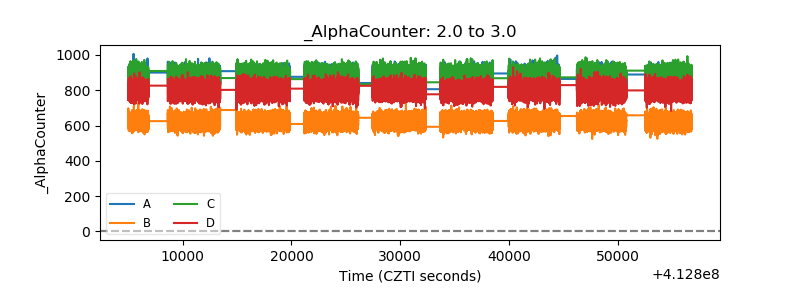 |
| _CPM_Rate | 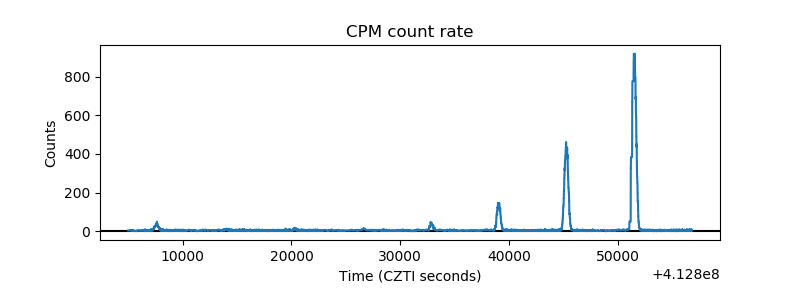 |
| CZT Counter | 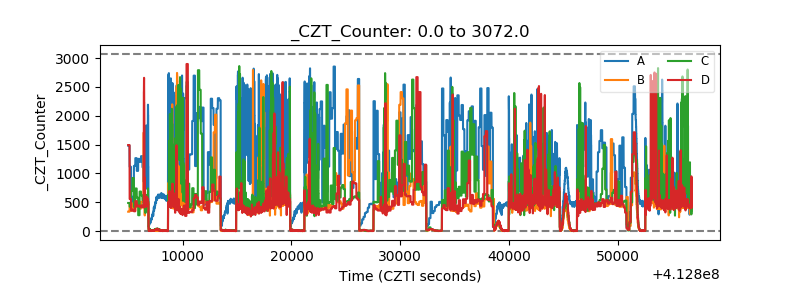 |
| +2.5 Volts monitor | 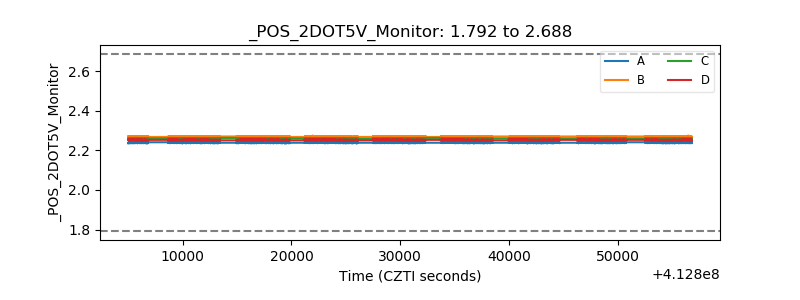 |
| +5 Volts monitor | 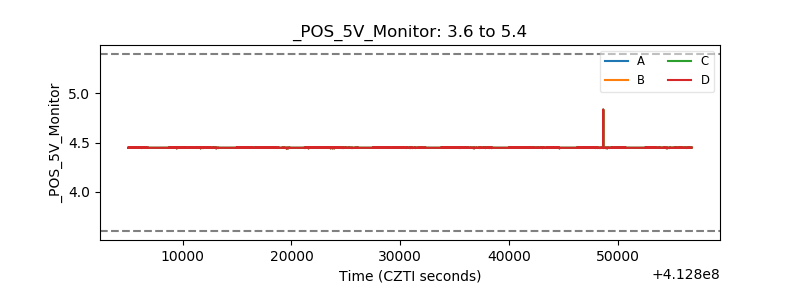 |
| _ROLL_ROT | 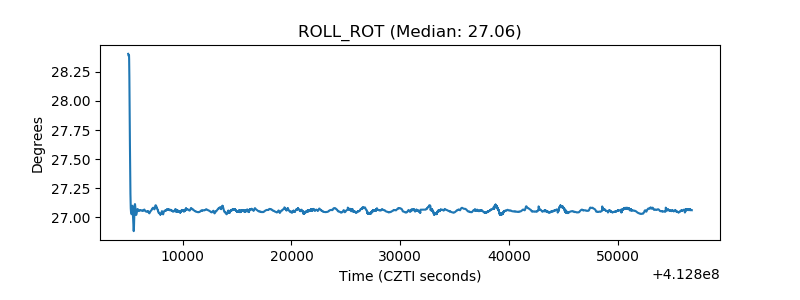 |
| _Roll_DEC | 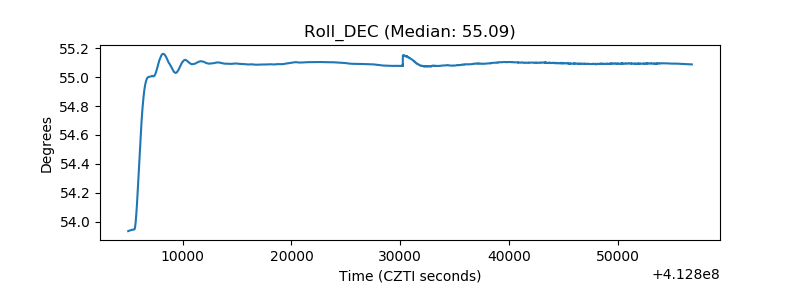 |
| _Roll_RA | 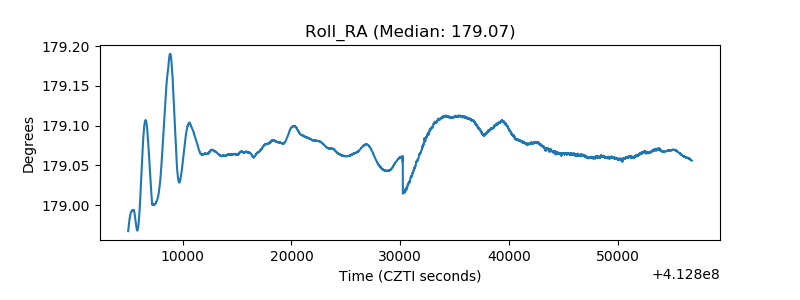 |
| Veto Counter | 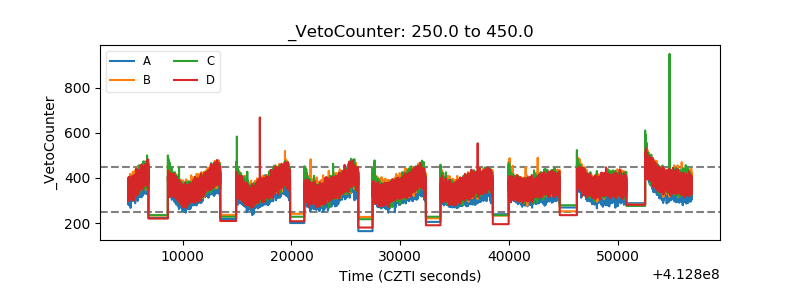 |