| Param | Original file | Final file |
|---|---|---|
| Filename | modeM0/AS1A12_022T01_9000005494cztM0_level2.fits | modeM0/AS1A12_022T01_9000005494cztM0_level2_quad_clean.evt |
| Size (bytes) | 2,565,950,400 | 2,998,615,680 |
| Size | 2.4 GB | 2.8 GB |
| Events in quadrant A | 15,395,616 | 18,583,426 |
| Events in quadrant B | 14,890,798 | 18,919,183 |
| Events in quadrant C | 15,001,150 | 17,705,100 |
| Events in quadrant D | 13,074,590 | 16,281,409 |
| Mode SS | |||
|---|---|---|---|
| Quadrant | BADHDUFLAG | Total packets | Discarded packets |
| A | 0 | 5768 | 0 |
| B | 0 | 5768 | 0 |
| C | 0 | 5768 | 0 |
| D | 0 | 5768 | 0 |
| Mode M0 | |||
|---|---|---|---|
| Quadrant | BADHDUFLAG | Total packets | Discarded packets |
| A | 0 | 692990 | 0 |
| B | 0 | 618020 | 0 |
| C | 0 | 773233 | 0 |
| D | 0 | 779042 | 0 |
| Mode M9 | |||
|---|---|---|---|
| Quadrant | BADHDUFLAG | Total packets | Discarded packets |
| A | 0 | 1088 | 0 |
| B | 0 | 1088 | 0 |
| C | 0 | 1088 | 0 |
| D | 0 | 1088 | 0 |
| Quadrant | Total seconds | Saturated seconds | Saturation percentage |
|---|---|---|---|
| A | 282310 | 8783 | 3.111119% |
| B | 282308 | 3243 | 1.148745% |
| C | 282308 | 11299 | 4.002366% |
| D | 282310 | 15568 | 5.514505% |
Noise dominated data is calculated using 1-second bins in cleaned event files. If a bin has >2000 counts, and if more than 50% of those come from <1% of pixels, then it is considered to be noise-dominated and hence unusable.
| Quadrant | # 1 sec bins | Bins with >0 counts | Bins with >2000 counts | High rate bins dominated by noise | Noise dominated (total time) | Noise dominated (detector-on time) | Marked lightcurve |
|---|---|---|---|---|---|---|---|
| A | 389526 | 282084 | 0 | 0 | 0.00% | 0.00% | 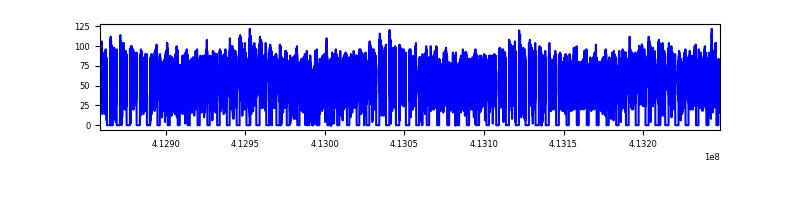 |
| B | 389526 | 282265 | 0 | 0 | 0.00% | 0.00% | 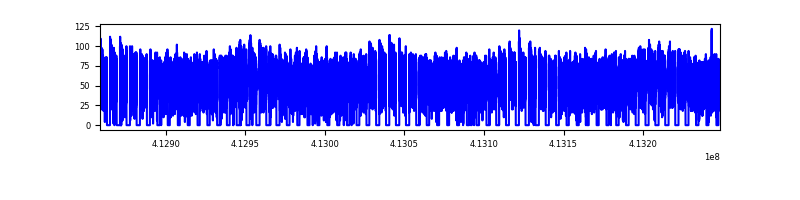 |
| C | 389526 | 282223 | 0 | 0 | 0.00% | 0.00% | 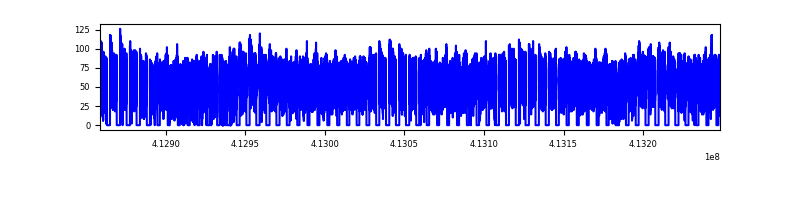 |
| D | 389526 | 282055 | 0 | 0 | 0.00% | 0.00% | 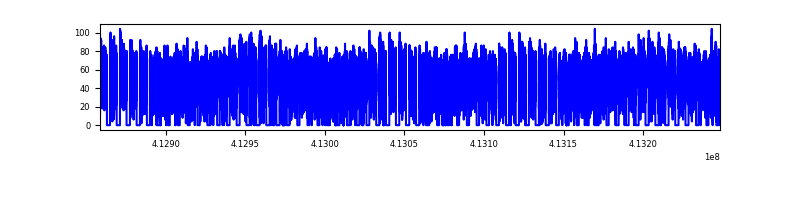 |
Top three noisy pixels from each quadrant. If the there are fewer than three noisy pixels in the level2.evt file, extra rows are filled as -1
| Pixel properties | Quadrant properties | ||||||
|---|---|---|---|---|---|---|---|
| Quadrant | DetID | PixID | Counts | Sigma | Mean | Median | Sigma |
| A | 9 | 19 | 12454 | 8.76 | 4025 | 3781 | 990.4 |
| A | 0 | 29 | 12393 | 8.7 | 4025 | 3781 | 990.4 |
| A | 7 | 110 | 12364 | 8.67 | 4025 | 3781 | 990.4 |
| B | 2 | 9 | 13105 | 12.21 | 3950 | 3772 | 764.5 |
| B | 3 | 80 | 10419 | 8.69 | 3950 | 3772 | 764.5 |
| B | 2 | 8 | 10395 | 8.66 | 3950 | 3772 | 764.5 |
| C | 1 | 81 | 12384 | 8.65 | 3966 | 3719 | 1001.3 |
| C | 1 | 80 | 11966 | 8.24 | 3966 | 3719 | 1001.3 |
| C | 3 | 202 | 11868 | 8.14 | 3966 | 3719 | 1001.3 |
| D | 7 | 3 | 9521 | 6.12 | 3749 | 3430 | 994.7 |
| D | 10 | 189 | 9482 | 6.08 | 3749 | 3430 | 994.7 |
| D | 4 | 160 | 9413 | 6.01 | 3749 | 3430 | 994.7 |
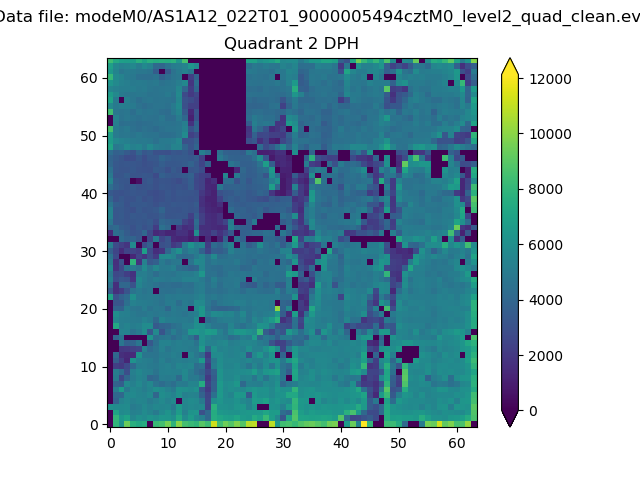
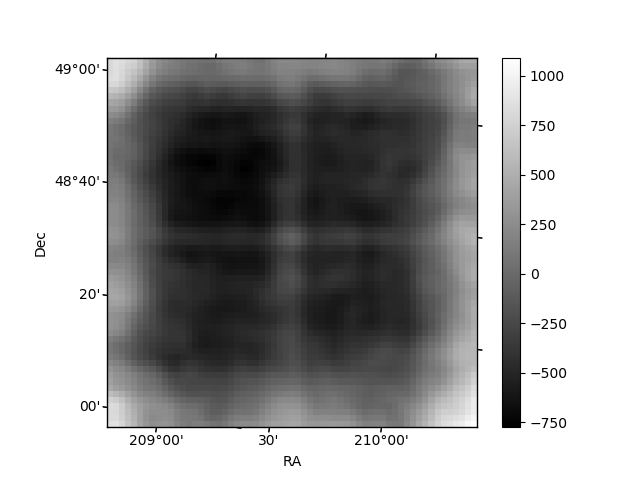
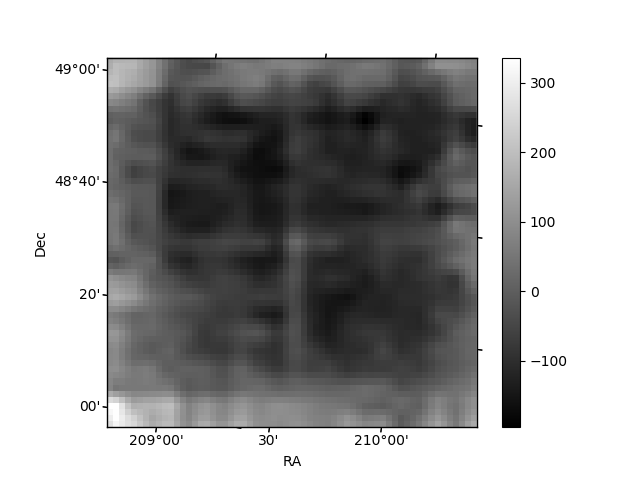
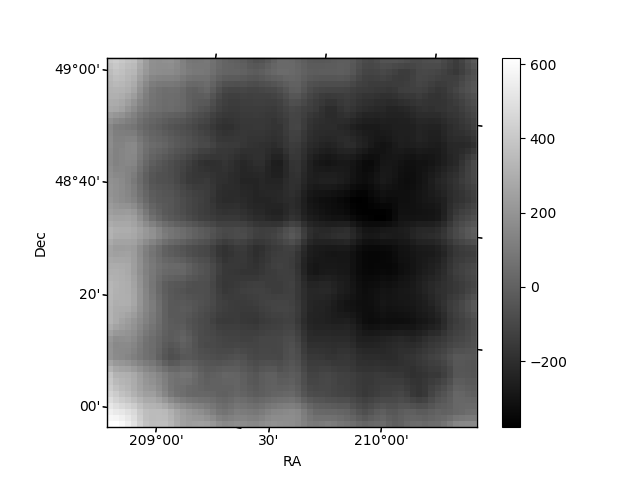
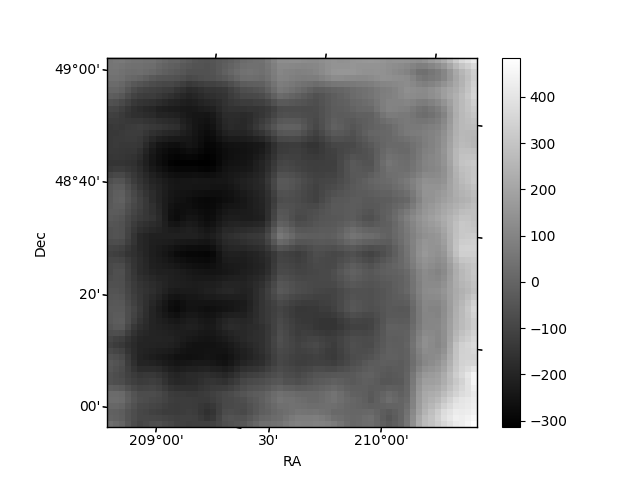
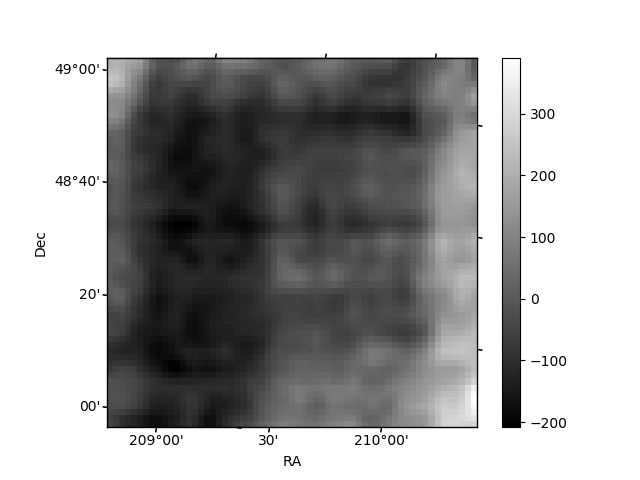
Histogram calculated using DETX and DETY for each event in the final _common_clean file
| Quadrant A | 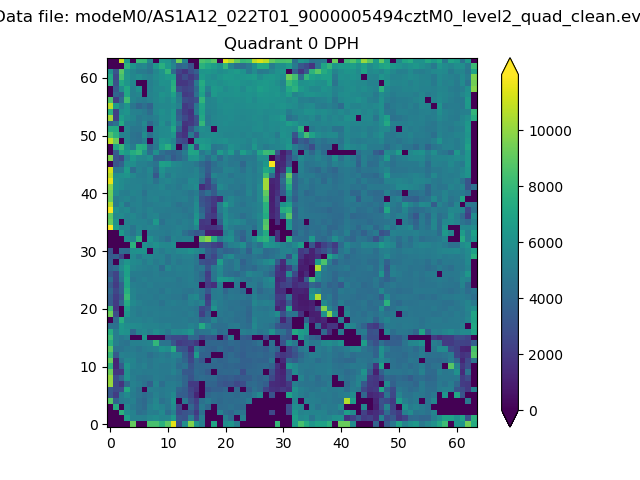 |
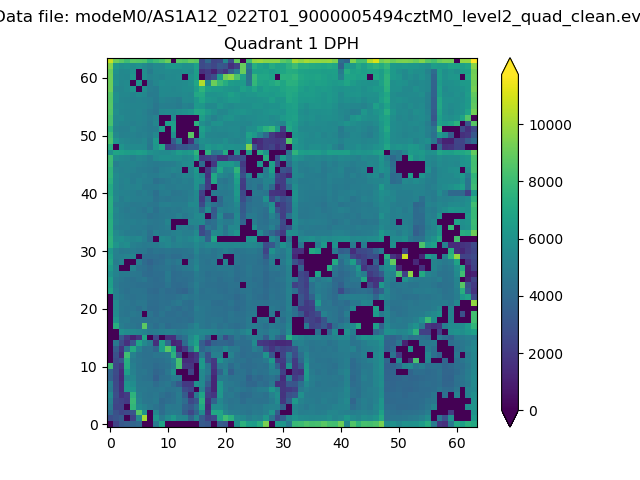 |
Quadrant B |
|---|---|---|---|
| Quadrant D | 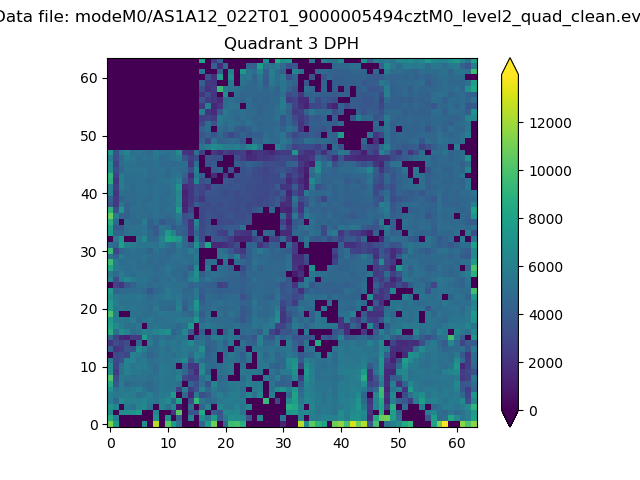 |
 |
Quadrant C |
| Plot type | Count rate plots | Images |
|---|---|---|
| Comparison with Poisson distribution Blue bars denote a histogram of data divided into 1 sec bins. Red curve is a Poisson curve with rate = median count rate of data. |
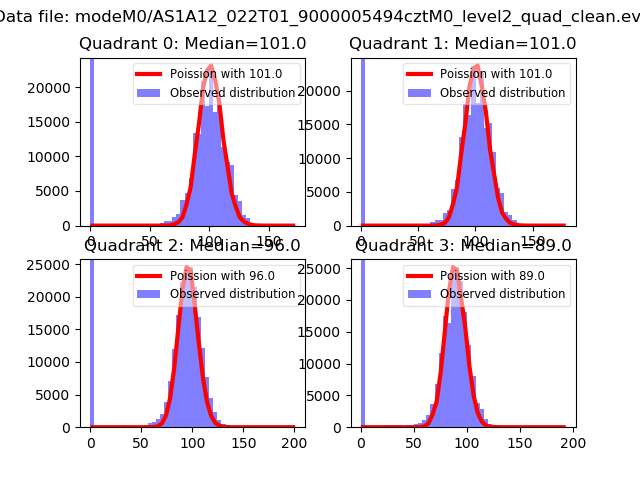 |
 |
| Quadrant-wise count rates Data is divided into 100 sec bins |
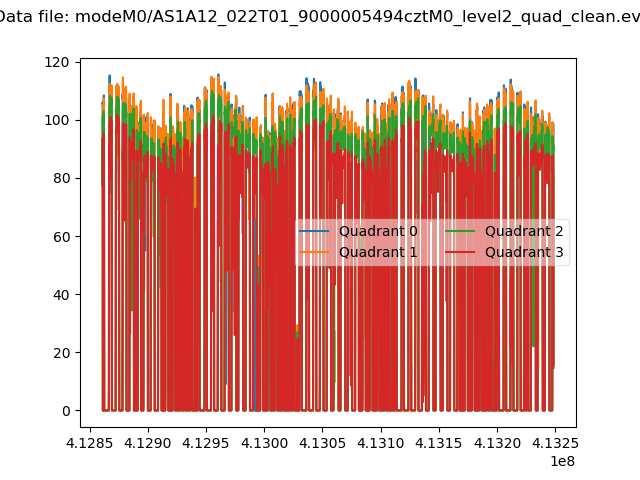 |
|
| Module-wise count rates for Quadrant A Data is divided into 100 sec bins |
 |
 |
| Module-wise count rates for Quadrant B Data is divided into 100 sec bins |
 |
 |
| Module-wise count rates for Quadrant C Data is divided into 100 sec bins |
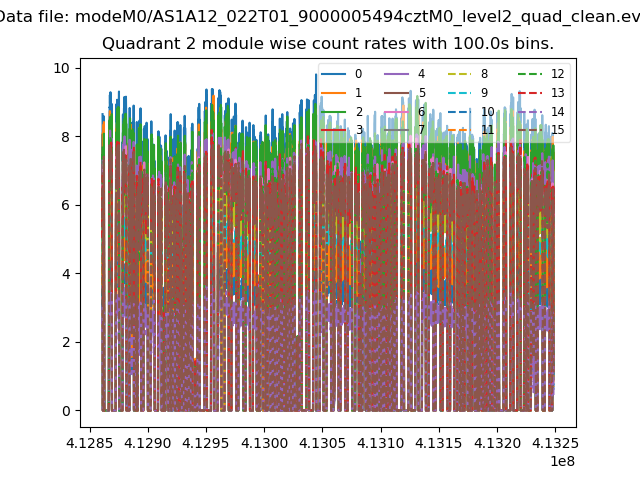 |
 |
| Module-wise count rates for Quadrant D Data is divided into 100 sec bins |
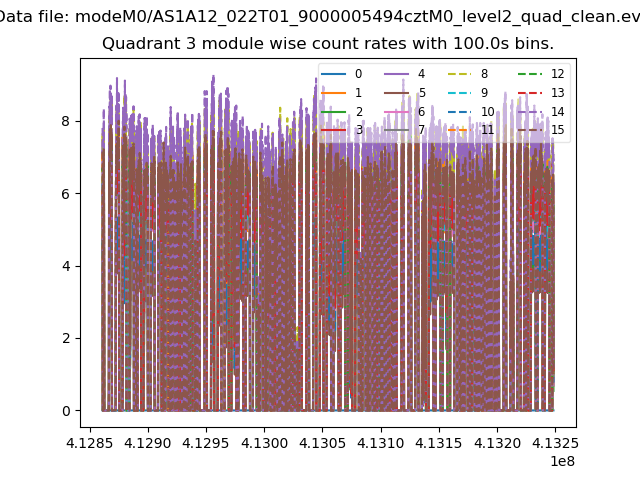 |
 |
| Parameter | Plot |
|---|---|
| CZT HV Monitor |  |
| D_VDD | 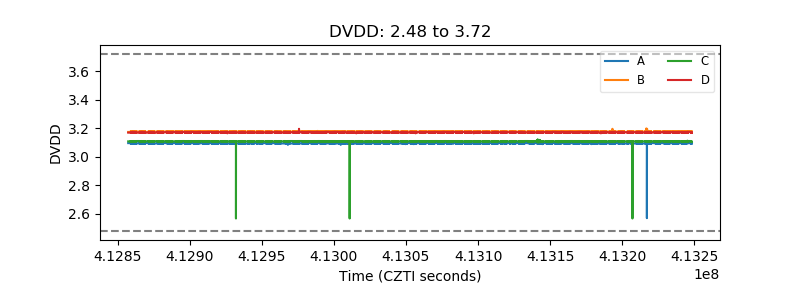 |
| Temperature 1 | 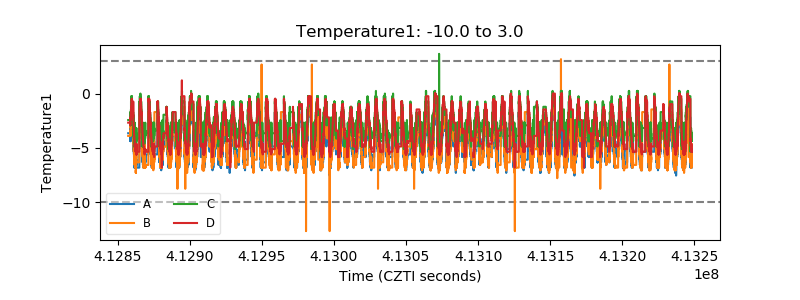 |
| Veto HV Monitor |  |
| Veto LLD | 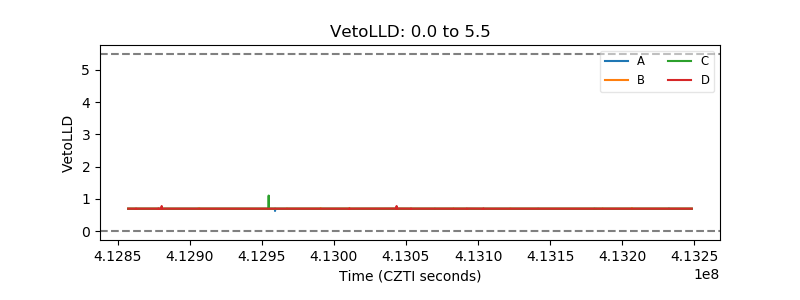 |
| Alpha Counter |  |
| _CPM_Rate | 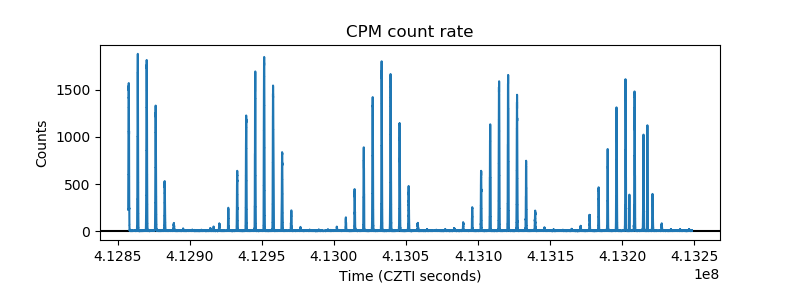 |
| CZT Counter |  |
| +2.5 Volts monitor |  |
| +5 Volts monitor | 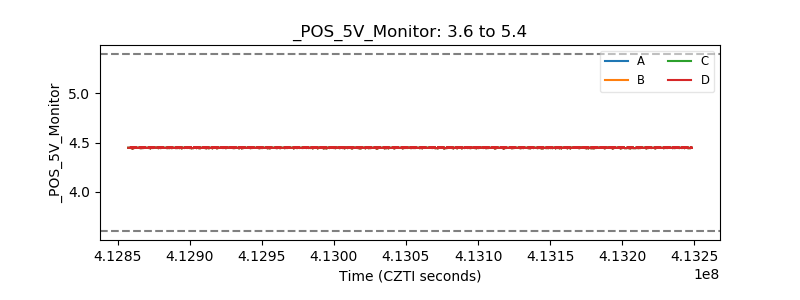 |
| _ROLL_ROT | 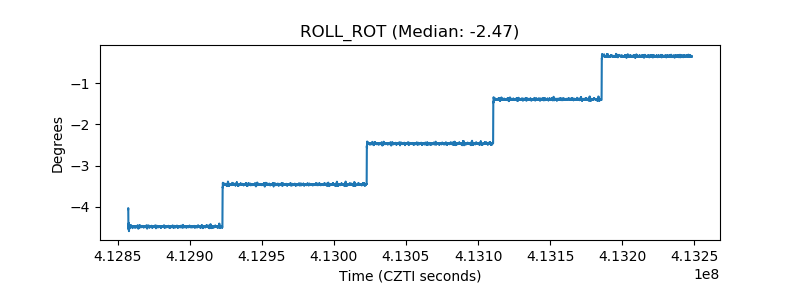 |
| _Roll_DEC | 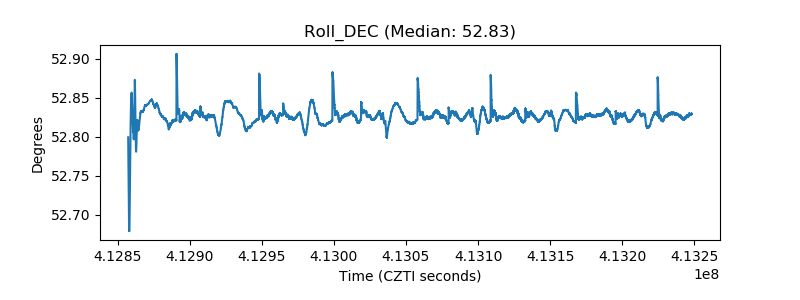 |
| _Roll_RA | 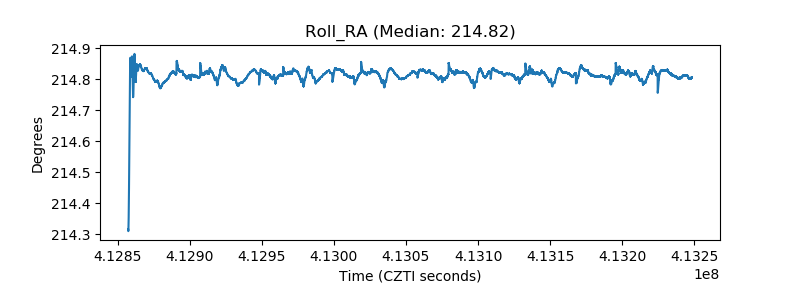 |
| Veto Counter | 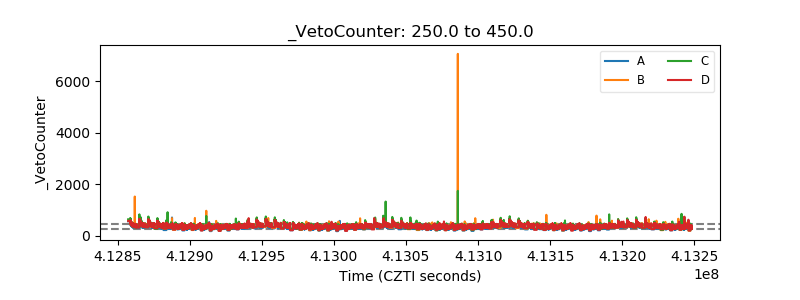 |