| Param | Original file | Final file |
|---|---|---|
| Filename | modeM0/AS1T05_086T01_9000005496cztM0_level2.fits | modeM0/AS1T05_086T01_9000005496cztM0_level2_quad_clean.evt |
| Size (bytes) | 714,908,160 | 880,263,360 |
| Size | 681.8 MB | 839.5 MB |
| Events in quadrant A | 4,387,078 | 5,858,218 |
| Events in quadrant B | 4,165,948 | 5,790,421 |
| Events in quadrant C | 3,979,034 | 4,851,953 |
| Events in quadrant D | 3,689,570 | 4,737,438 |
| Mode SS | |||
|---|---|---|---|
| Quadrant | BADHDUFLAG | Total packets | Discarded packets |
| A | 0 | 1614 | 0 |
| B | 0 | 1616 | 0 |
| C | 0 | 1616 | 0 |
| D | 0 | 1617 | 0 |
| Mode M9 | |||
|---|---|---|---|
| Quadrant | BADHDUFLAG | Total packets | Discarded packets |
| A | 0 | 298 | 0 |
| B | 0 | 297 | 0 |
| C | 0 | 298 | 0 |
| D | 0 | 297 | 0 |
| Mode M0 | |||
|---|---|---|---|
| Quadrant | BADHDUFLAG | Total packets | Discarded packets |
| A | 0 | 191447 | 0 |
| B | 0 | 187464 | 0 |
| C | 0 | 301626 | 0 |
| D | 0 | 205995 | 0 |
| Quadrant | Total seconds | Saturated seconds | Saturation percentage |
|---|---|---|---|
| A | 79088 | 1516 | 1.916852% |
| B | 79137 | 1853 | 2.341509% |
| C | 79035 | 9970 | 12.614664% |
| D | 79107 | 3473 | 4.390256% |
Noise dominated data is calculated using 1-second bins in cleaned event files. If a bin has >2000 counts, and if more than 50% of those come from <1% of pixels, then it is considered to be noise-dominated and hence unusable.
| Quadrant | # 1 sec bins | Bins with >0 counts | Bins with >2000 counts | High rate bins dominated by noise | Noise dominated (total time) | Noise dominated (detector-on time) | Marked lightcurve |
|---|---|---|---|---|---|---|---|
| A | 109695 | 79138 | 0 | 0 | 0.00% | 0.00% | 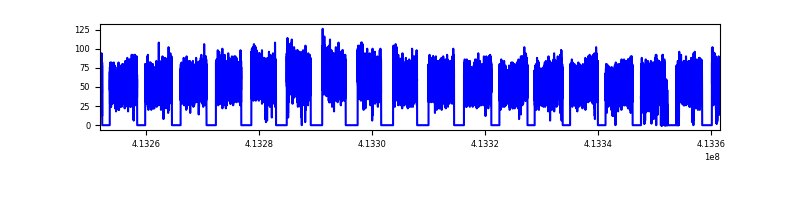 |
| B | 109695 | 79229 | 0 | 0 | 0.00% | 0.00% | 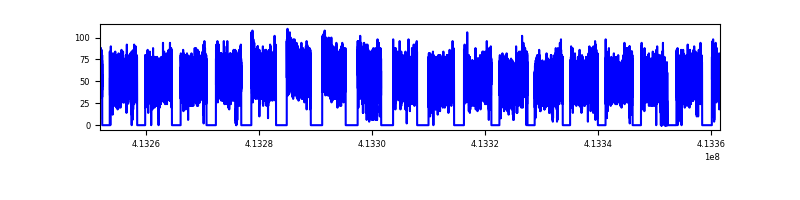 |
| C | 109695 | 79055 | 0 | 0 | 0.00% | 0.00% | 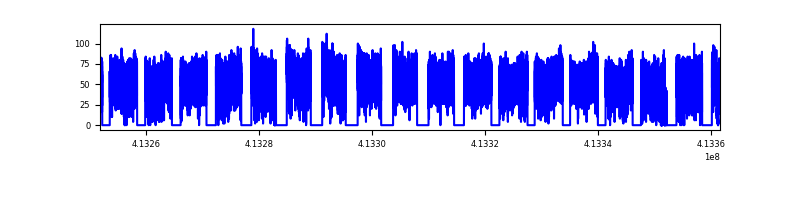 |
| D | 109695 | 79168 | 0 | 0 | 0.00% | 0.00% |  |
Top three noisy pixels from each quadrant. If the there are fewer than three noisy pixels in the level2.evt file, extra rows are filled as -1
| Pixel properties | Quadrant properties | ||||||
|---|---|---|---|---|---|---|---|
| Quadrant | DetID | PixID | Counts | Sigma | Mean | Median | Sigma |
| A | 14 | 188 | 5214 | 14.75 | 1141 | 1072 | 280.8 |
| A | 14 | 204 | 4185 | 11.09 | 1141 | 1072 | 280.8 |
| A | 7 | 110 | 3720 | 9.43 | 1141 | 1072 | 280.8 |
| B | 2 | 9 | 3645 | 12.07 | 1102 | 1052 | 214.9 |
| B | 3 | 80 | 3030 | 9.2 | 1102 | 1052 | 214.9 |
| B | 2 | 8 | 2861 | 8.42 | 1102 | 1052 | 214.9 |
| C | 1 | 81 | 3517 | 9.39 | 1051 | 987 | 269.5 |
| C | 1 | 80 | 3449 | 9.14 | 1051 | 987 | 269.5 |
| C | 3 | 203 | 3127 | 7.94 | 1051 | 987 | 269.5 |
| D | 7 | 3 | 2785 | 6.41 | 1054 | 957 | 285.0 |
| D | 6 | 67 | 2660 | 5.98 | 1054 | 957 | 285.0 |
| D | 6 | 231 | 2646 | 5.93 | 1054 | 957 | 285.0 |
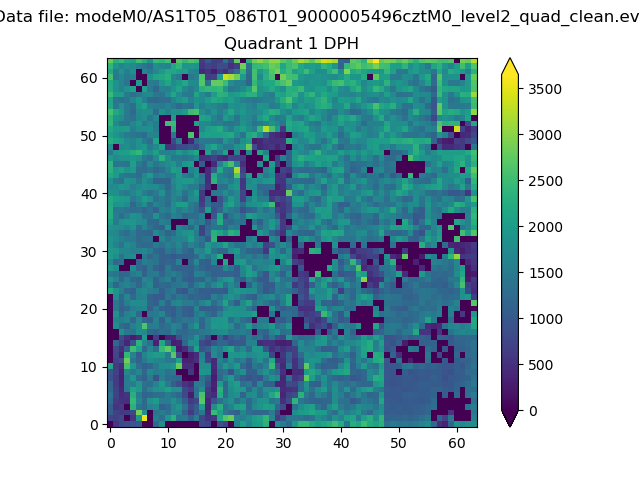
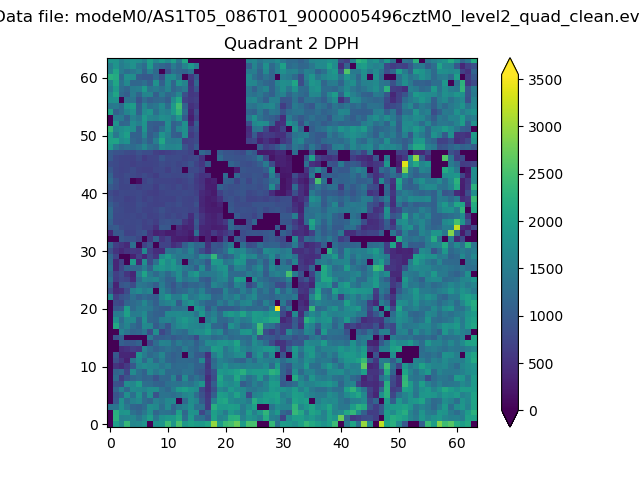
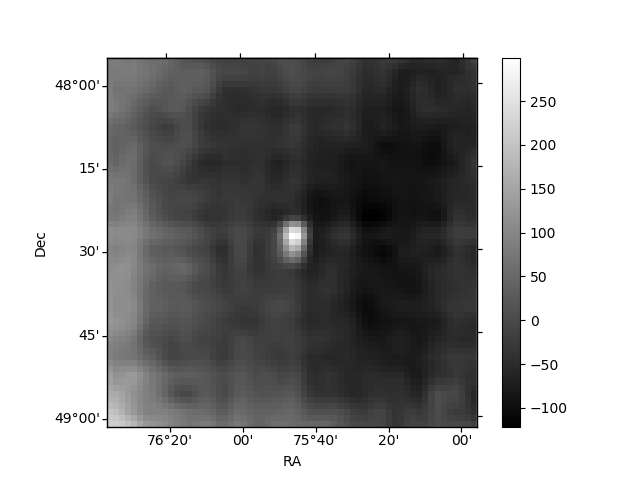
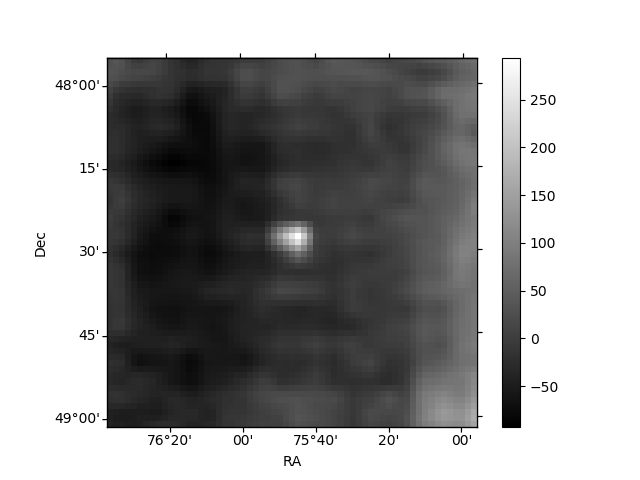
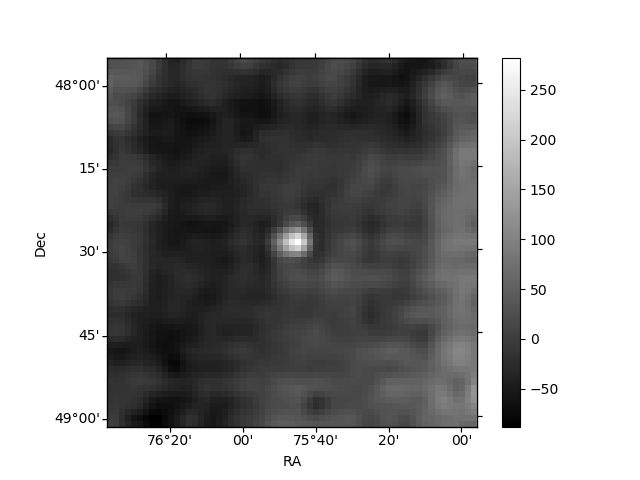
Histogram calculated using DETX and DETY for each event in the final _common_clean file
| Quadrant A | 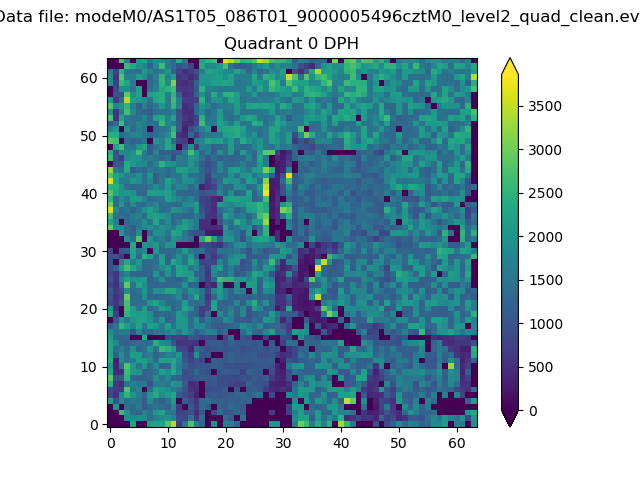 |
 |
Quadrant B |
|---|---|---|---|
| Quadrant D | 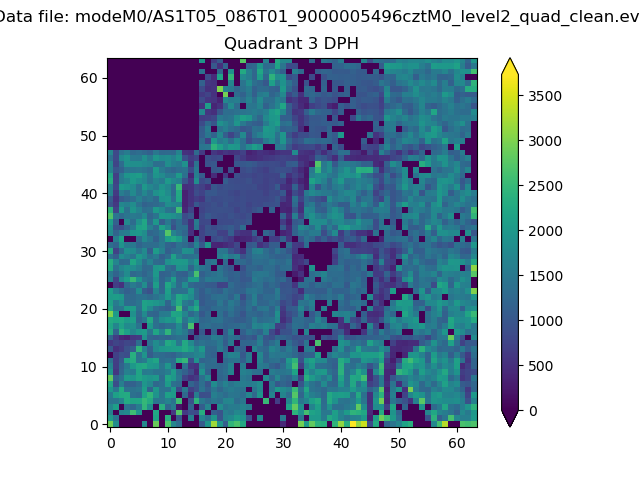 |
 |
Quadrant C |
| Plot type | Count rate plots | Images |
|---|---|---|
| Comparison with Poisson distribution Blue bars denote a histogram of data divided into 1 sec bins. Red curve is a Poisson curve with rate = median count rate of data. |
 |
 |
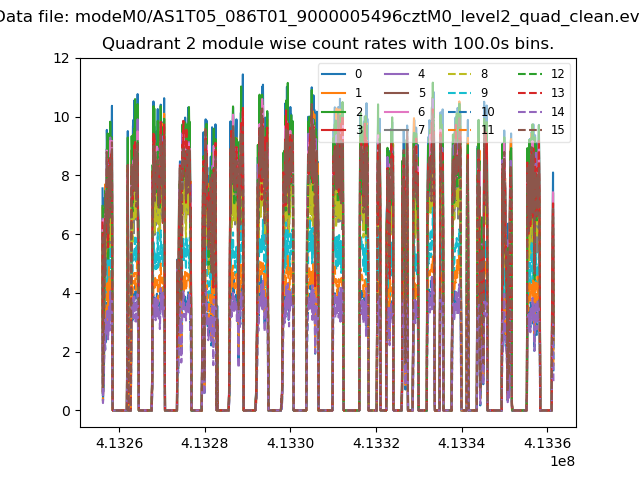
| Quadrant-wise count rates Data is divided into 100 sec bins |
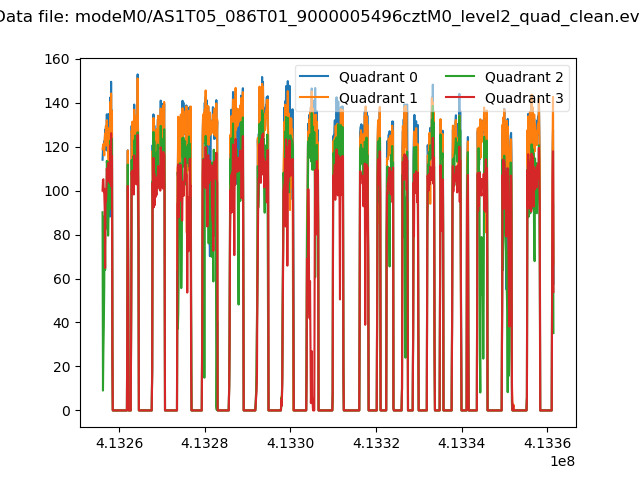 |
|
| Module-wise count rates for Quadrant A Data is divided into 100 sec bins |
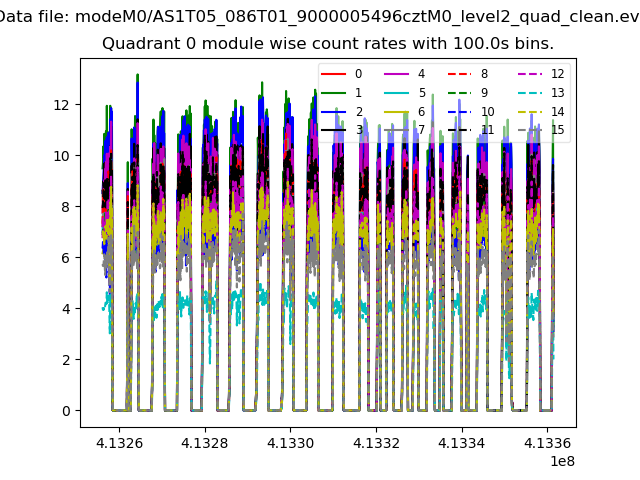 |
 |
| Module-wise count rates for Quadrant B Data is divided into 100 sec bins |
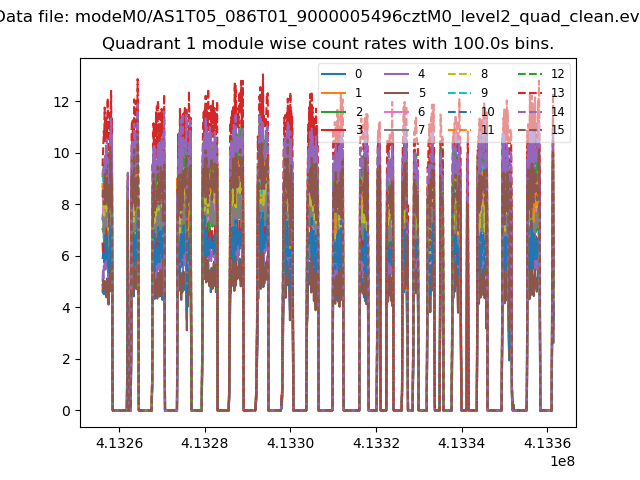 |
 |
| Module-wise count rates for Quadrant C Data is divided into 100 sec bins |
 |
 |
| Module-wise count rates for Quadrant D Data is divided into 100 sec bins |
 |
 |
| Parameter | Plot |
|---|---|
| CZT HV Monitor | 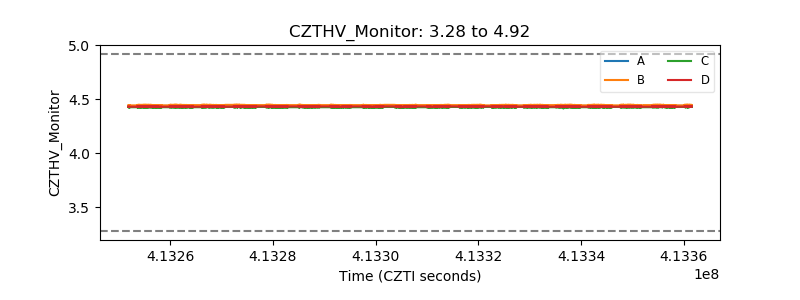 |
| D_VDD | 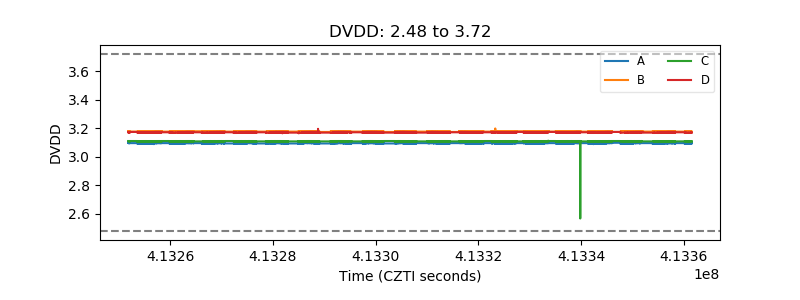 |
| Temperature 1 |  |
| Veto HV Monitor | 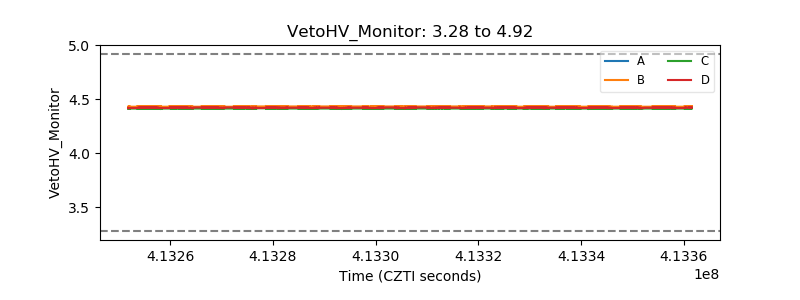 |
| Veto LLD | 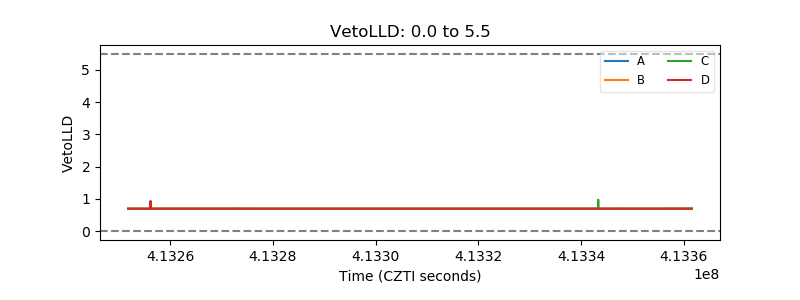 |
| Alpha Counter | 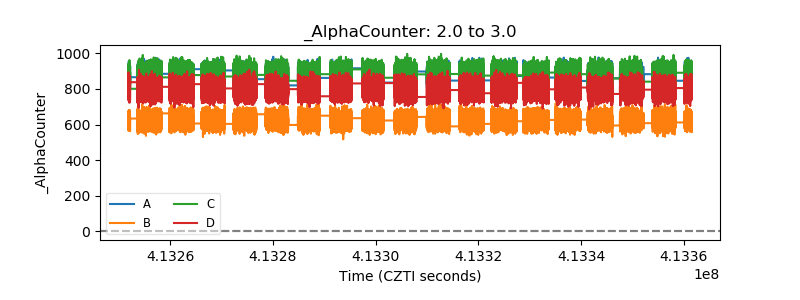 |
| _CPM_Rate | 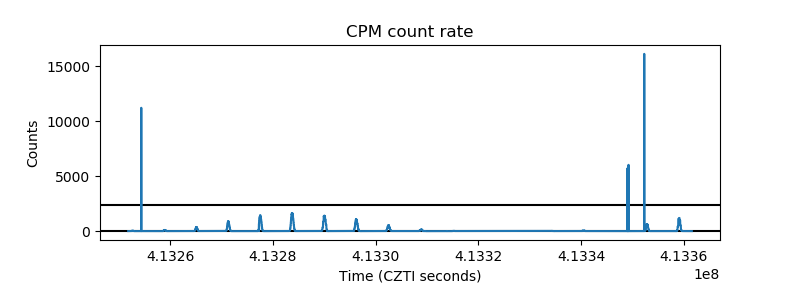 |
| CZT Counter | 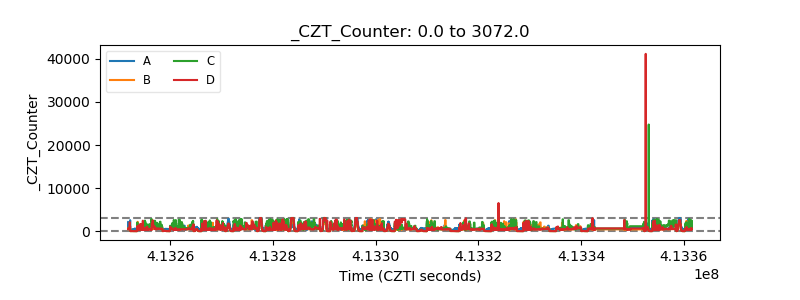 |
| +2.5 Volts monitor |  |
| +5 Volts monitor | 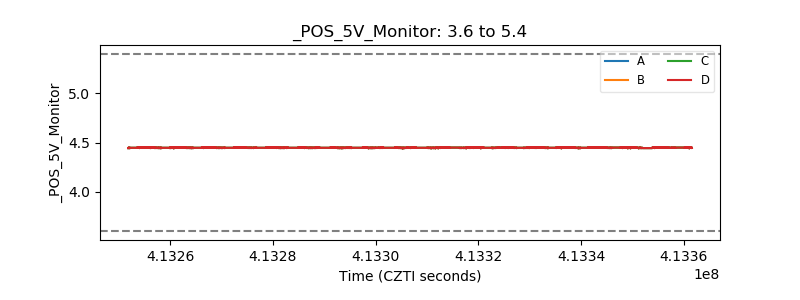 |
| _ROLL_ROT |  |
| _Roll_DEC | 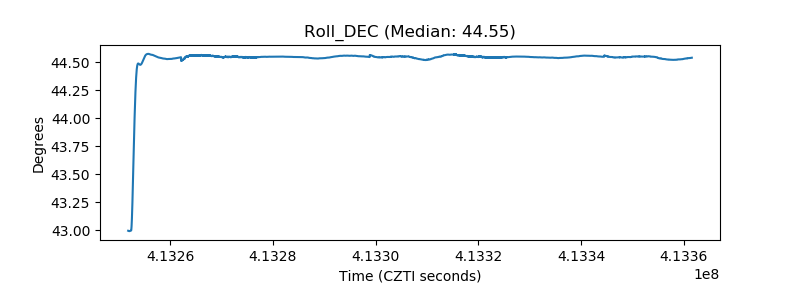 |
| _Roll_RA | 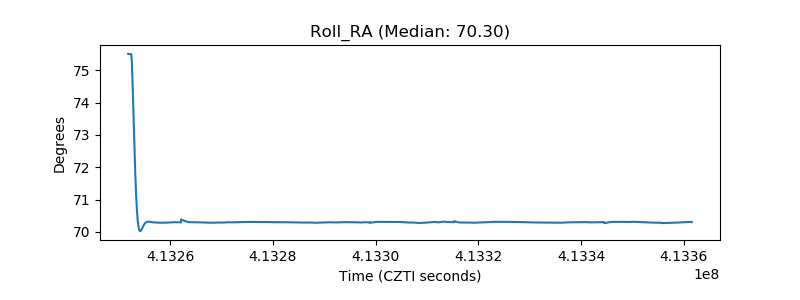 |
| Veto Counter |  |