| Param | Original file | Final file |
|---|---|---|
| Filename | modeM0/AS1A12_032T02_9000005500cztM0_level2.fits | modeM0/AS1A12_032T02_9000005500cztM0_level2_quad_clean.evt |
| Size (bytes) | 398,566,080 | 370,330,560 |
| Size | 380.1 MB | 353.2 MB |
| Events in quadrant A | 2,296,030 | 2,061,848 |
| Events in quadrant B | 2,285,656 | 2,147,559 |
| Events in quadrant C | 2,378,078 | 2,074,635 |
| Events in quadrant D | 2,039,910 | 1,863,198 |
| Mode M9 | |||
|---|---|---|---|
| Quadrant | BADHDUFLAG | Total packets | Discarded packets |
| A | 0 | 183 | 0 |
| B | 0 | 183 | 0 |
| C | 0 | 183 | 0 |
| D | 0 | 183 | 0 |
| Mode SS | |||
|---|---|---|---|
| Quadrant | BADHDUFLAG | Total packets | Discarded packets |
| A | 0 | 912 | 0 |
| B | 0 | 912 | 0 |
| C | 0 | 912 | 0 |
| D | 0 | 912 | 0 |
| Mode M0 | |||
|---|---|---|---|
| Quadrant | BADHDUFLAG | Total packets | Discarded packets |
| A | 0 | 135893 | 0 |
| B | 0 | 118565 | 0 |
| C | 0 | 109199 | 0 |
| D | 0 | 124348 | 0 |
| Quadrant | Total seconds | Saturated seconds | Saturation percentage |
|---|---|---|---|
| A | 44683 | 4627 | 10.355169% |
| B | 44684 | 1660 | 3.714976% |
| C | 44684 | 1395 | 3.121923% |
| D | 44684 | 2522 | 5.644078% |
Noise dominated data is calculated using 1-second bins in cleaned event files. If a bin has >2000 counts, and if more than 50% of those come from <1% of pixels, then it is considered to be noise-dominated and hence unusable.
| Quadrant | # 1 sec bins | Bins with >0 counts | Bins with >2000 counts | High rate bins dominated by noise | Noise dominated (total time) | Noise dominated (detector-on time) | Marked lightcurve |
|---|---|---|---|---|---|---|---|
| A | 62881 | 44552 | 0 | 0 | 0.00% | 0.00% |  |
| B | 62881 | 44677 | 0 | 0 | 0.00% | 0.00% |  |
| C | 62881 | 44679 | 0 | 0 | 0.00% | 0.00% |  |
| D | 62881 | 44618 | 0 | 0 | 0.00% | 0.00% |  |
Top three noisy pixels from each quadrant. If the there are fewer than three noisy pixels in the level2.evt file, extra rows are filled as -1
| Pixel properties | Quadrant properties | ||||||
|---|---|---|---|---|---|---|---|
| Quadrant | DetID | PixID | Counts | Sigma | Mean | Median | Sigma |
| A | 0 | 29 | 1937 | 9.28 | 599 | 564 | 147.9 |
| A | 7 | 110 | 1917 | 9.15 | 599 | 564 | 147.9 |
| A | 9 | 19 | 1833 | 8.58 | 599 | 564 | 147.9 |
| B | 2 | 9 | 1978 | 11.69 | 607 | 580 | 119.6 |
| B | 2 | 8 | 1631 | 8.79 | 607 | 580 | 119.6 |
| B | 3 | 17 | 1562 | 8.21 | 607 | 580 | 119.6 |
| C | 1 | 81 | 2015 | 8.85 | 628 | 590 | 161.0 |
| C | 3 | 202 | 1936 | 8.36 | 628 | 590 | 161.0 |
| C | 1 | 80 | 1887 | 8.05 | 628 | 590 | 161.0 |
| D | 10 | 113 | 1529 | 6.41 | 585 | 534 | 155.3 |
| D | 10 | 189 | 1488 | 6.14 | 585 | 534 | 155.3 |
| D | 6 | 67 | 1474 | 6.05 | 585 | 534 | 155.3 |
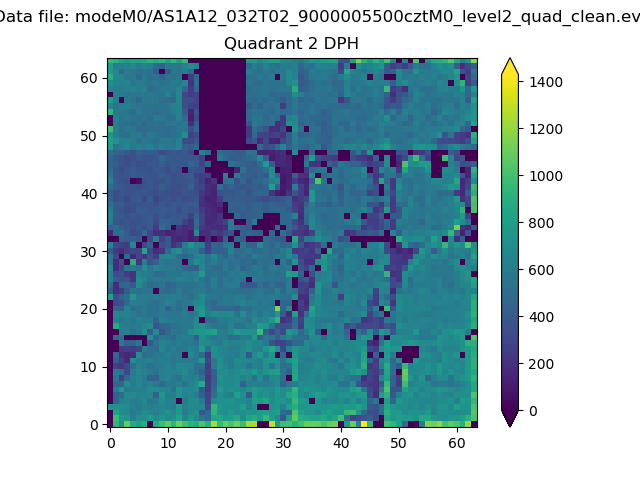
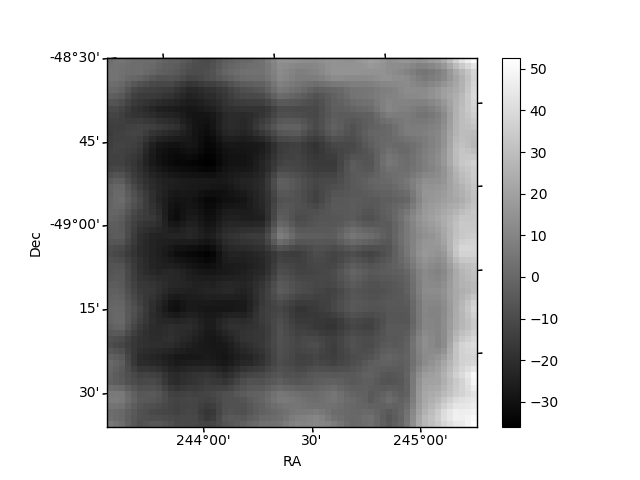
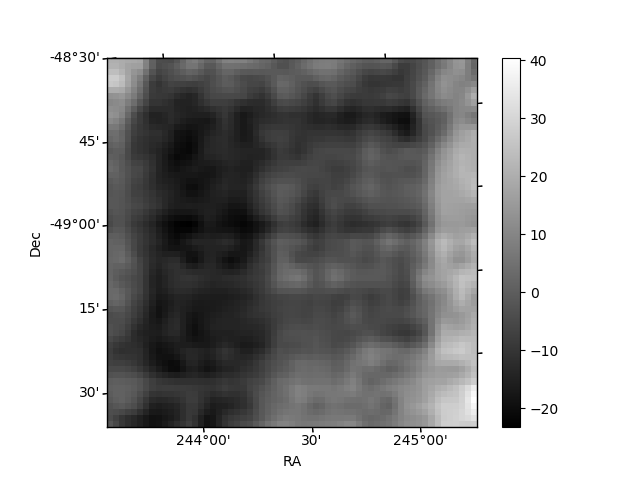
Histogram calculated using DETX and DETY for each event in the final _common_clean file
| Quadrant A | 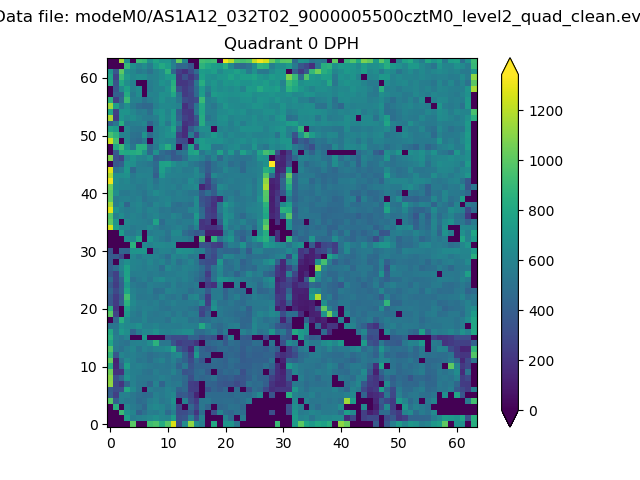 |
 |
Quadrant B |
|---|---|---|---|
| Quadrant D |  |
 |
Quadrant C |
| Plot type | Count rate plots | Images |
|---|---|---|
| Comparison with Poisson distribution Blue bars denote a histogram of data divided into 1 sec bins. Red curve is a Poisson curve with rate = median count rate of data. |
 |
 |
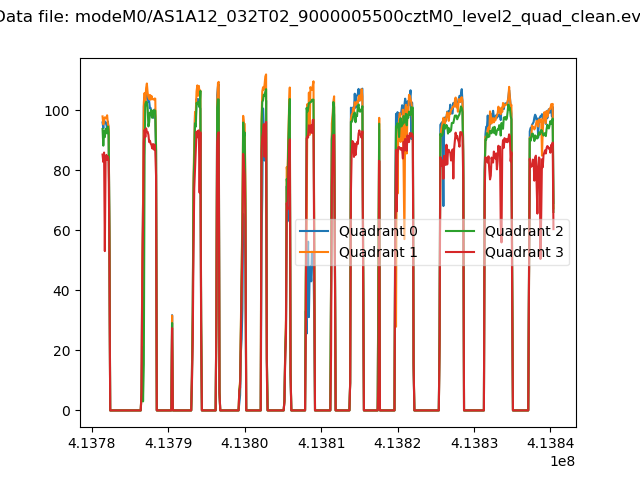
| Quadrant-wise count rates Data is divided into 100 sec bins |
 |
|
| Module-wise count rates for Quadrant A Data is divided into 100 sec bins |
 |
 |
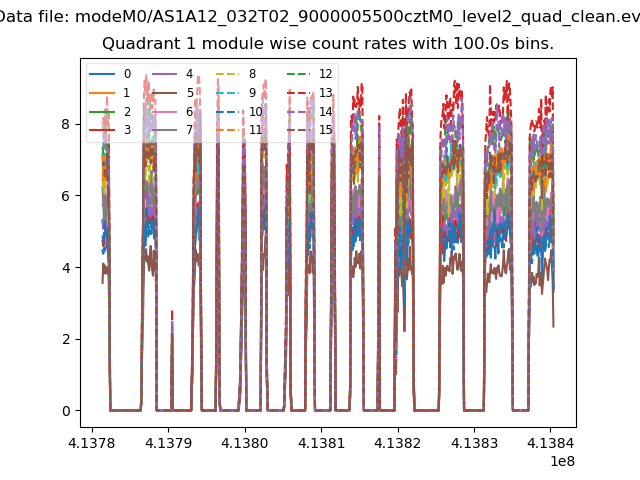
| Module-wise count rates for Quadrant B Data is divided into 100 sec bins |
 |
 |
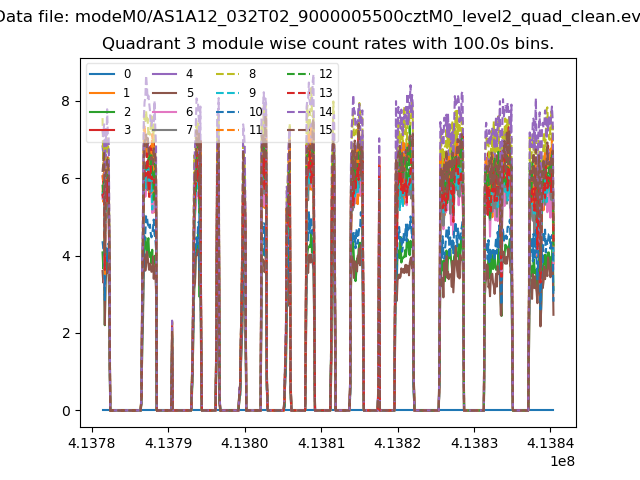
| Module-wise count rates for Quadrant C Data is divided into 100 sec bins |
 |
 |
| Module-wise count rates for Quadrant D Data is divided into 100 sec bins |
 |
 |
| Parameter | Plot |
|---|---|
| CZT HV Monitor | 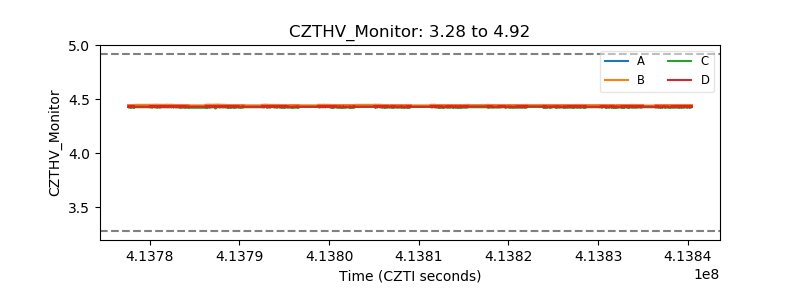 |
| D_VDD |  |
| Temperature 1 | 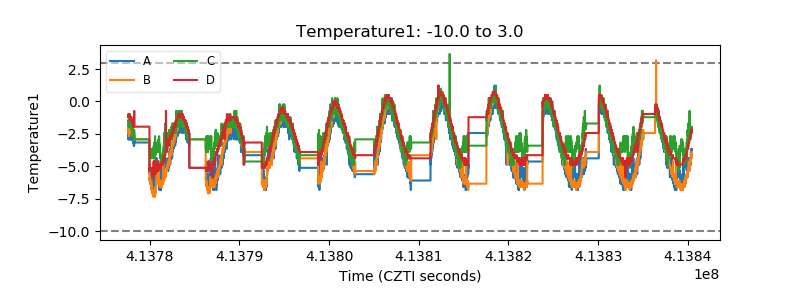 |
| Veto HV Monitor |  |
| Veto LLD |  |
| Alpha Counter |  |
| _CPM_Rate |  |
| CZT Counter |  |
| +2.5 Volts monitor |  |
| +5 Volts monitor |  |
| _ROLL_ROT |  |
| _Roll_DEC |  |
| _Roll_RA | 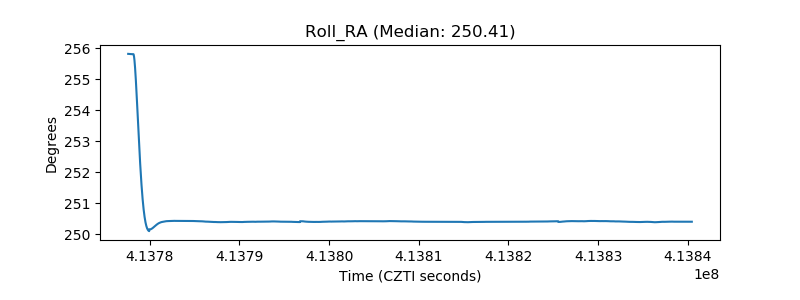 |
| Veto Counter | 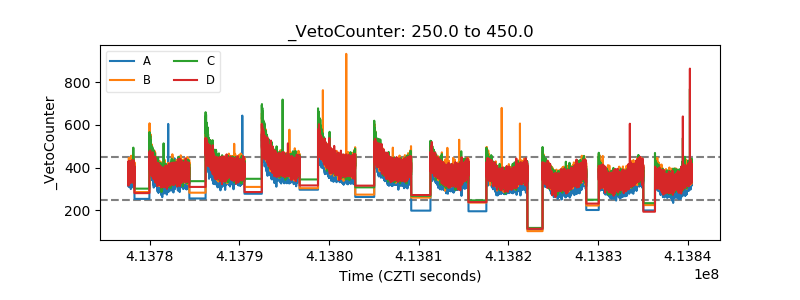 |