| Param | Original file | Final file |
|---|---|---|
| Filename | modeM0/AS1A12_032T03_9000005502cztM0_level2.fits | modeM0/AS1A12_032T03_9000005502cztM0_level2_quad_clean.evt |
| Size (bytes) | 599,322,240 | 653,221,440 |
| Size | 571.6 MB | 623.0 MB |
| Events in quadrant A | 3,534,870 | 3,949,639 |
| Events in quadrant B | 3,414,854 | 3,977,380 |
| Events in quadrant C | 3,573,426 | 3,841,291 |
| Events in quadrant D | 3,022,056 | 3,412,130 |
| Mode SS | |||
|---|---|---|---|
| Quadrant | BADHDUFLAG | Total packets | Discarded packets |
| A | 0 | 1364 | 0 |
| B | 0 | 1364 | 0 |
| C | 0 | 1364 | 0 |
| D | 0 | 1364 | 0 |
| Mode M9 | |||
|---|---|---|---|
| Quadrant | BADHDUFLAG | Total packets | Discarded packets |
| A | 0 | 256 | 0 |
| B | 0 | 256 | 0 |
| C | 0 | 256 | 0 |
| D | 0 | 256 | 0 |
| Mode M0 | |||
|---|---|---|---|
| Quadrant | BADHDUFLAG | Total packets | Discarded packets |
| A | 0 | 164330 | 0 |
| B | 0 | 159089 | 0 |
| C | 0 | 142585 | 0 |
| D | 0 | 190293 | 0 |
| Quadrant | Total seconds | Saturated seconds | Saturation percentage |
|---|---|---|---|
| A | 67146 | 2130 | 3.172192% |
| B | 67146 | 1028 | 1.530992% |
| C | 67146 | 325 | 0.484020% |
| D | 67146 | 3715 | 5.532720% |
Noise dominated data is calculated using 1-second bins in cleaned event files. If a bin has >2000 counts, and if more than 50% of those come from <1% of pixels, then it is considered to be noise-dominated and hence unusable.
| Quadrant | # 1 sec bins | Bins with >0 counts | Bins with >2000 counts | High rate bins dominated by noise | Noise dominated (total time) | Noise dominated (detector-on time) | Marked lightcurve |
|---|---|---|---|---|---|---|---|
| A | 92297 | 67047 | 0 | 0 | 0.00% | 0.00% | 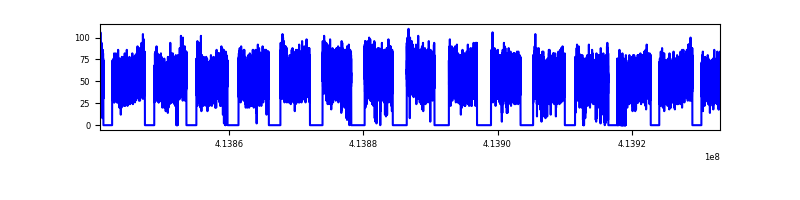 |
| B | 92297 | 67145 | 0 | 0 | 0.00% | 0.00% |  |
| C | 92297 | 67145 | 0 | 0 | 0.00% | 0.00% |  |
| D | 92297 | 67040 | 0 | 0 | 0.00% | 0.00% | 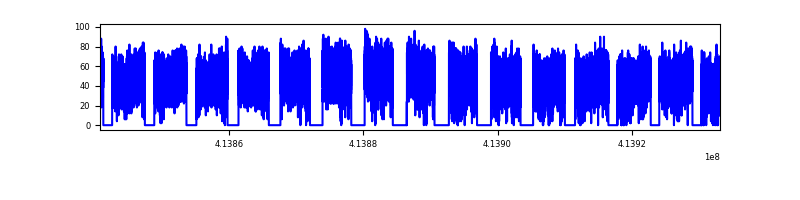 |
Top three noisy pixels from each quadrant. If the there are fewer than three noisy pixels in the level2.evt file, extra rows are filled as -1
| Pixel properties | Quadrant properties | ||||||
|---|---|---|---|---|---|---|---|
| Quadrant | DetID | PixID | Counts | Sigma | Mean | Median | Sigma |
| A | 7 | 110 | 2953 | 9.17 | 925 | 868 | 227.4 |
| A | 0 | 29 | 2860 | 8.76 | 925 | 868 | 227.4 |
| A | 9 | 19 | 2785 | 8.43 | 925 | 868 | 227.4 |
| B | 2 | 9 | 2979 | 12.13 | 906 | 867 | 174.1 |
| B | 3 | 17 | 2450 | 9.09 | 906 | 867 | 174.1 |
| B | 3 | 80 | 2442 | 9.05 | 906 | 867 | 174.1 |
| C | 1 | 81 | 2952 | 8.54 | 946 | 886 | 241.9 |
| C | 1 | 80 | 2917 | 8.39 | 946 | 886 | 241.9 |
| C | 3 | 203 | 2861 | 8.16 | 946 | 886 | 241.9 |
| D | 10 | 189 | 2206 | 6.17 | 866 | 789 | 229.7 |
| D | 4 | 160 | 2195 | 6.12 | 866 | 789 | 229.7 |
| D | 7 | 3 | 2182 | 6.06 | 866 | 789 | 229.7 |
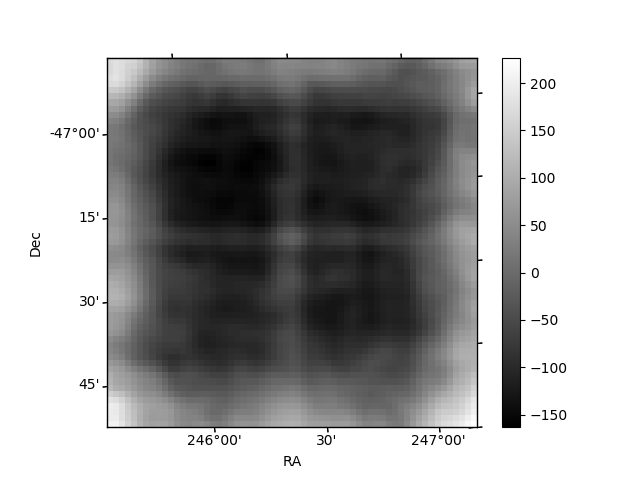
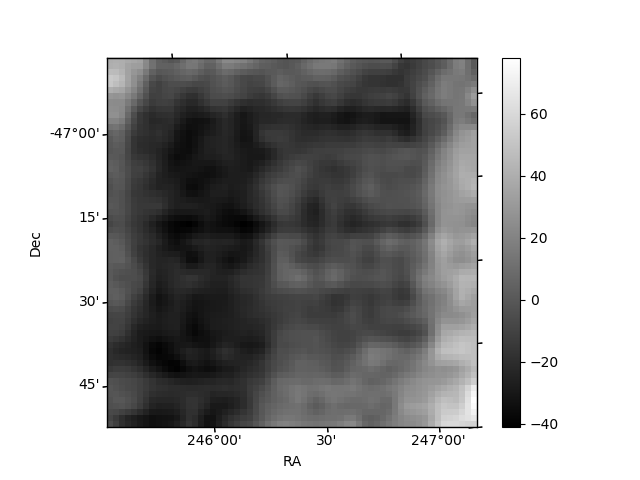
Histogram calculated using DETX and DETY for each event in the final _common_clean file
| Quadrant A | 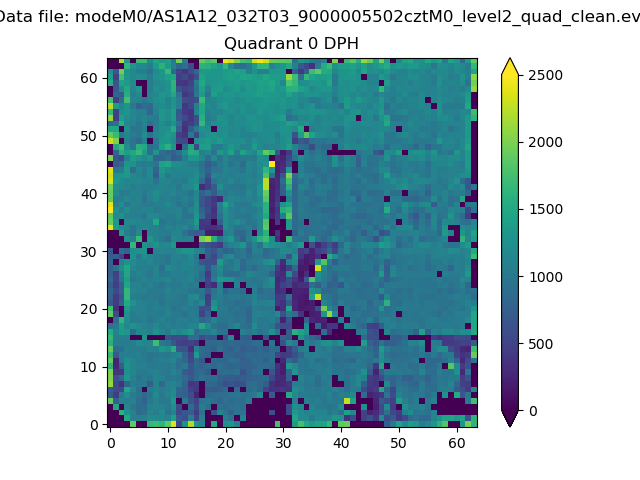 |
 |
Quadrant B |
|---|---|---|---|
| Quadrant D |  |
 |
Quadrant C |
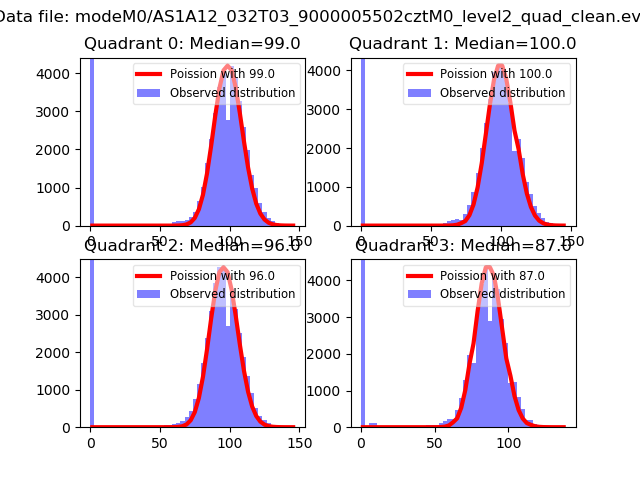
| Plot type | Count rate plots | Images |
|---|---|---|
| Comparison with Poisson distribution Blue bars denote a histogram of data divided into 1 sec bins. Red curve is a Poisson curve with rate = median count rate of data. |
 |
 |
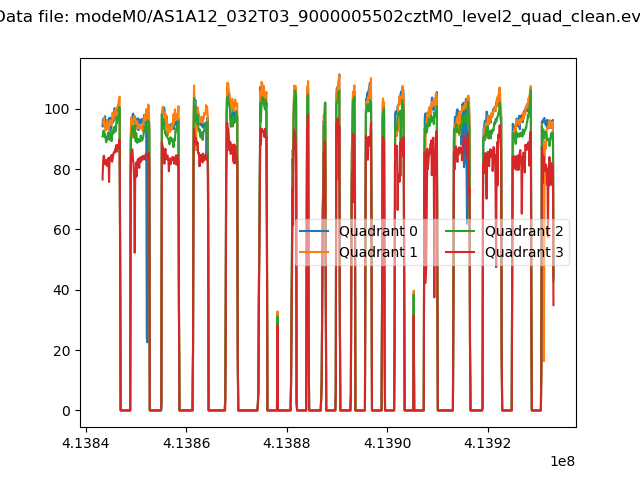
| Quadrant-wise count rates Data is divided into 100 sec bins |
 |
|
| Module-wise count rates for Quadrant A Data is divided into 100 sec bins |
 |
 |
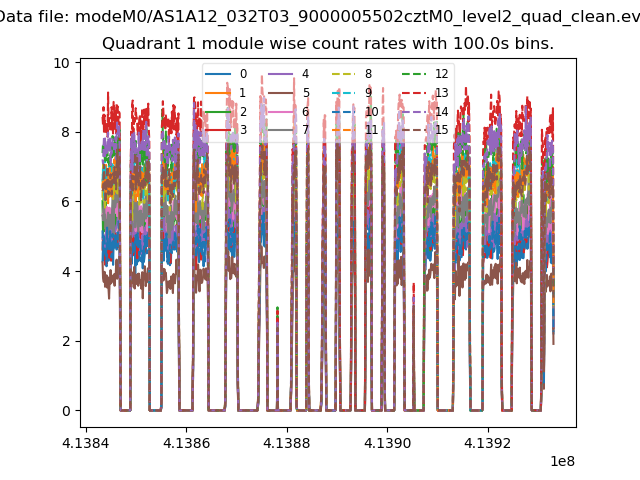
| Module-wise count rates for Quadrant B Data is divided into 100 sec bins |
 |
 |
| Module-wise count rates for Quadrant C Data is divided into 100 sec bins |
 |
 |
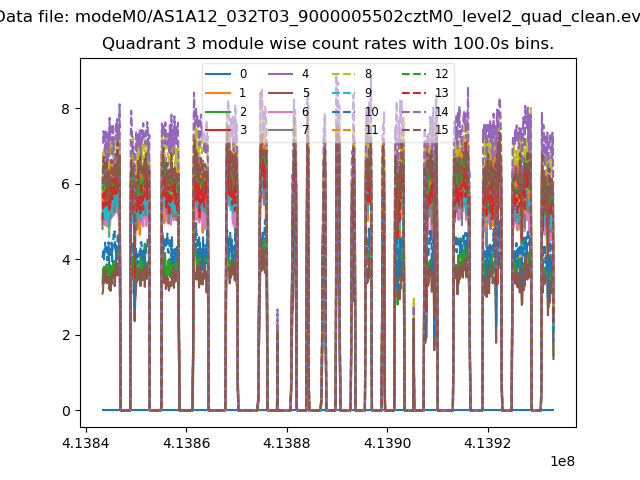
| Module-wise count rates for Quadrant D Data is divided into 100 sec bins |
 |
 |
| Parameter | Plot |
|---|---|
| CZT HV Monitor |  |
| D_VDD | 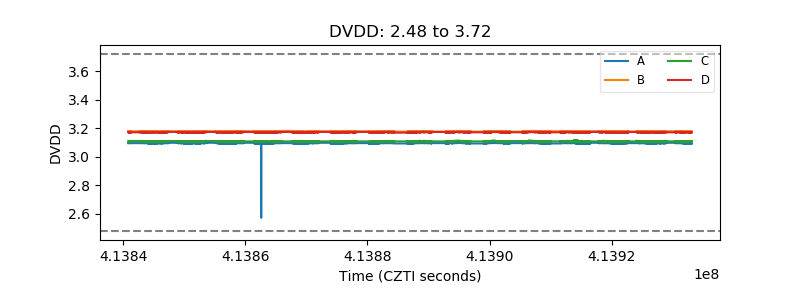 |
| Temperature 1 |  |
| Veto HV Monitor | 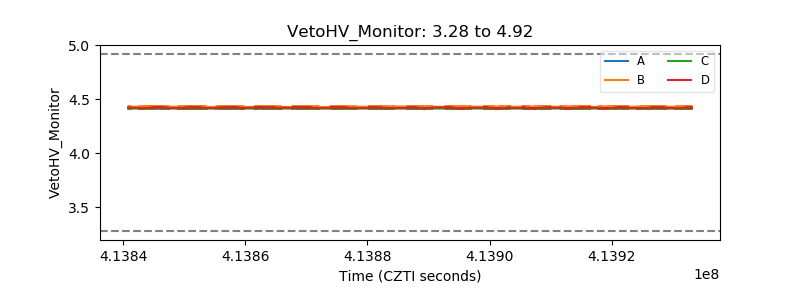 |
| Veto LLD |  |
| Alpha Counter | 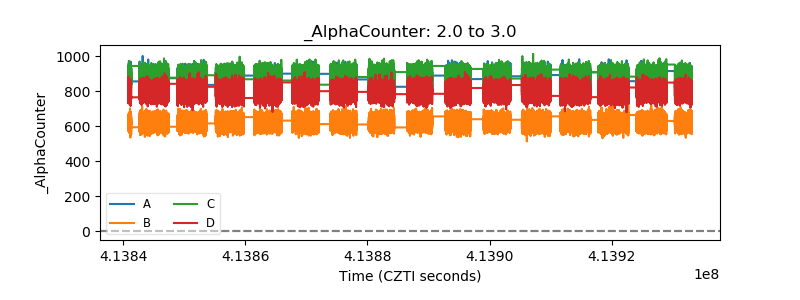 |
| _CPM_Rate |  |
| CZT Counter | 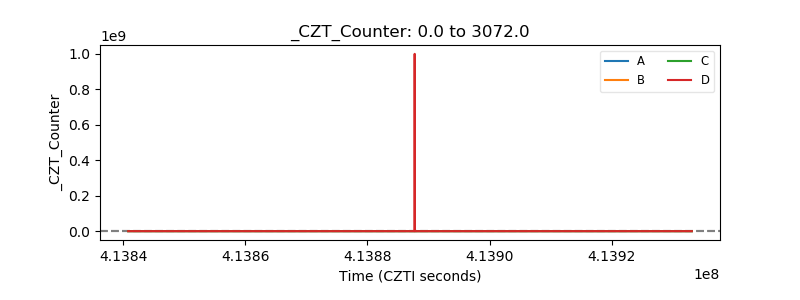 |
| +2.5 Volts monitor | 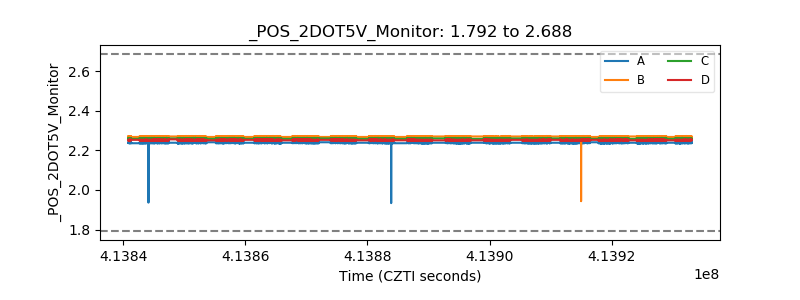 |
| +5 Volts monitor | 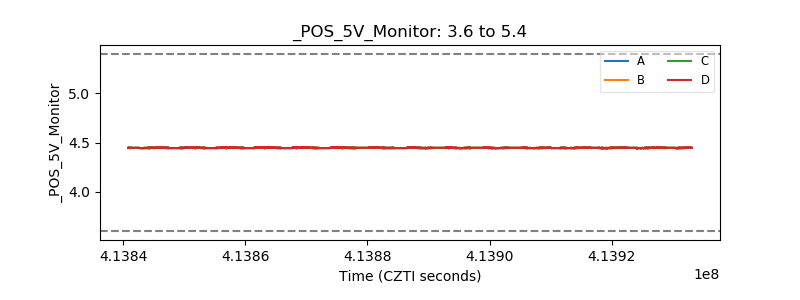 |
| _ROLL_ROT |  |
| _Roll_DEC |  |
| _Roll_RA |  |
| Veto Counter | 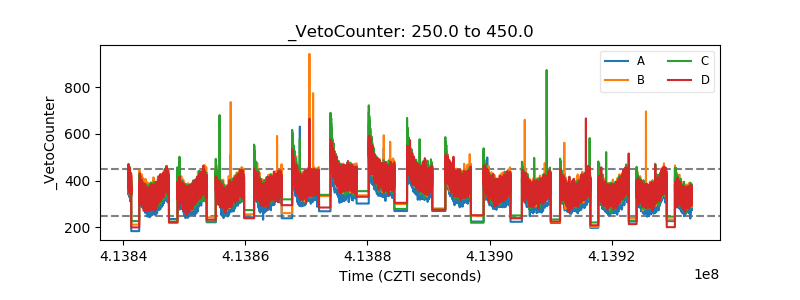 |