| Param | Original file | Final file |
|---|---|---|
| Filename | modeM0/AS1A12_037T07_9000005504cztM0_level2.fits | modeM0/AS1A12_037T07_9000005504cztM0_level2_quad_clean.evt |
| Size (bytes) | 266,950,080 | 196,444,800 |
| Size | 254.6 MB | 187.3 MB |
| Events in quadrant A | 1,623,332 | 1,026,495 |
| Events in quadrant B | 1,536,970 | 1,041,855 |
| Events in quadrant C | 1,586,614 | 1,001,225 |
| Events in quadrant D | 1,372,250 | 912,774 |
| Mode SS | |||
|---|---|---|---|
| Quadrant | BADHDUFLAG | Total packets | Discarded packets |
| A | 0 | 586 | 0 |
| B | 0 | 586 | 0 |
| C | 0 | 586 | 0 |
| D | 0 | 586 | 0 |
| Mode M0 | |||
|---|---|---|---|
| Quadrant | BADHDUFLAG | Total packets | Discarded packets |
| A | 0 | 65454 | 0 |
| B | 0 | 62340 | 0 |
| C | 0 | 59252 | 0 |
| D | 0 | 71232 | 0 |
| Mode M9 | |||
|---|---|---|---|
| Quadrant | BADHDUFLAG | Total packets | Discarded packets |
| A | 0 | 133 | 0 |
| B | 0 | 133 | 0 |
| C | 0 | 133 | 0 |
| D | 0 | 134 | 0 |
| Quadrant | Total seconds | Saturated seconds | Saturation percentage |
|---|---|---|---|
| A | 28589 | 243 | 0.849977% |
| B | 28587 | 382 | 1.336272% |
| C | 28594 | 92 | 0.321746% |
| D | 28588 | 751 | 2.626976% |
Noise dominated data is calculated using 1-second bins in cleaned event files. If a bin has >2000 counts, and if more than 50% of those come from <1% of pixels, then it is considered to be noise-dominated and hence unusable.
| Quadrant | # 1 sec bins | Bins with >0 counts | Bins with >2000 counts | High rate bins dominated by noise | Noise dominated (total time) | Noise dominated (detector-on time) | Marked lightcurve |
|---|---|---|---|---|---|---|---|
| A | 47479 | 28594 | 0 | 0 | 0.00% | 0.00% |  |
| B | 47479 | 28573 | 0 | 0 | 0.00% | 0.00% |  |
| C | 47479 | 28599 | 0 | 0 | 0.00% | 0.00% |  |
| D | 47479 | 28589 | 0 | 0 | 0.00% | 0.00% |  |
Top three noisy pixels from each quadrant. If the there are fewer than three noisy pixels in the level2.evt file, extra rows are filled as -1
| Pixel properties | Quadrant properties | ||||||
|---|---|---|---|---|---|---|---|
| Quadrant | DetID | PixID | Counts | Sigma | Mean | Median | Sigma |
| A | 7 | 110 | 1327 | 8.78 | 423 | 397 | 105.9 |
| A | 0 | 29 | 1320 | 8.71 | 423 | 397 | 105.9 |
| A | 9 | 19 | 1238 | 7.94 | 423 | 397 | 105.9 |
| B | 2 | 9 | 1333 | 11.77 | 407 | 389 | 80.2 |
| B | 3 | 80 | 1202 | 10.14 | 407 | 389 | 80.2 |
| B | 2 | 8 | 1119 | 9.1 | 407 | 389 | 80.2 |
| C | 1 | 81 | 1269 | 8.12 | 419 | 393 | 107.9 |
| C | 3 | 203 | 1268 | 8.11 | 419 | 393 | 107.9 |
| C | 1 | 80 | 1267 | 8.1 | 419 | 393 | 107.9 |
| D | 4 | 160 | 1017 | 6.28 | 393 | 358 | 105.0 |
| D | 7 | 3 | 1012 | 6.23 | 393 | 358 | 105.0 |
| D | 10 | 189 | 992 | 6.04 | 393 | 358 | 105.0 |
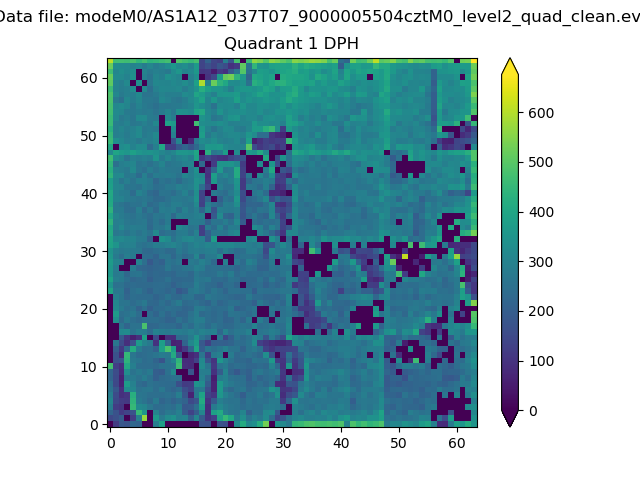
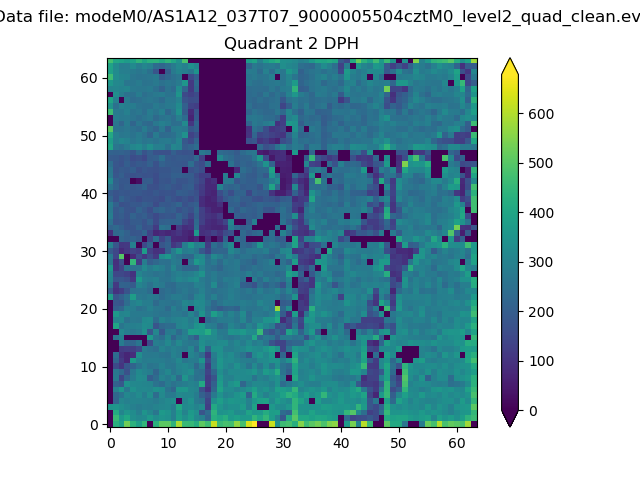
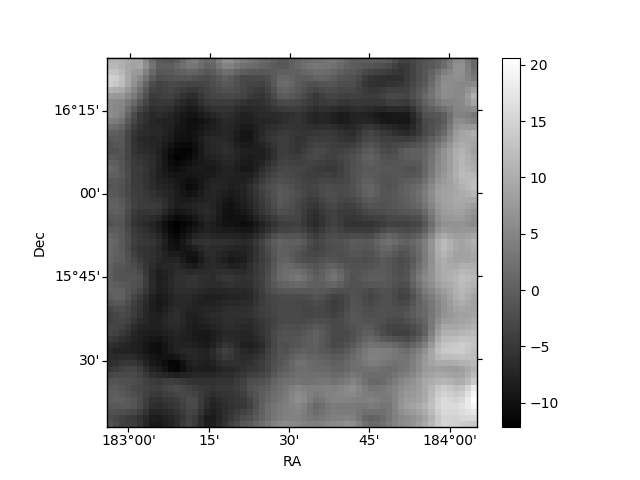
Histogram calculated using DETX and DETY for each event in the final _common_clean file
| Quadrant A |  |
 |
Quadrant B |
|---|---|---|---|
| Quadrant D |  |
 |
Quadrant C |
| Plot type | Count rate plots | Images |
|---|---|---|
| Comparison with Poisson distribution Blue bars denote a histogram of data divided into 1 sec bins. Red curve is a Poisson curve with rate = median count rate of data. |
 |
 |
| Quadrant-wise count rates Data is divided into 100 sec bins |
 |
|
| Module-wise count rates for Quadrant A Data is divided into 100 sec bins |
 |
 |
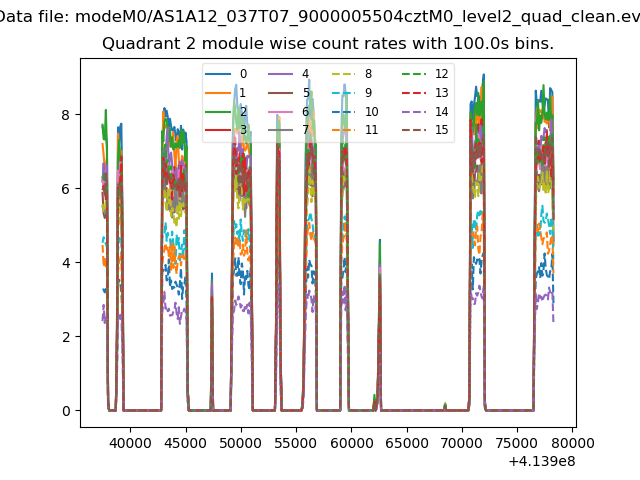
| Module-wise count rates for Quadrant B Data is divided into 100 sec bins |
 |
 |
| Module-wise count rates for Quadrant C Data is divided into 100 sec bins |
 |
 |
| Module-wise count rates for Quadrant D Data is divided into 100 sec bins |
 |
 |
| Parameter | Plot |
|---|---|
| CZT HV Monitor | 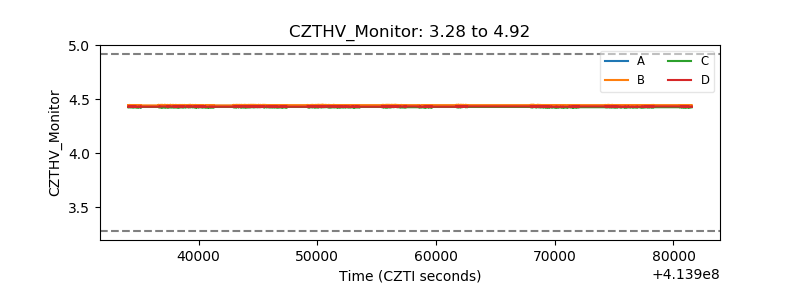 |
| D_VDD |  |
| Temperature 1 | 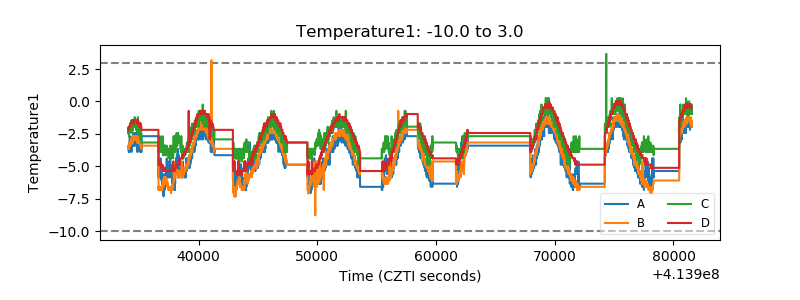 |
| Veto HV Monitor |  |
| Veto LLD | 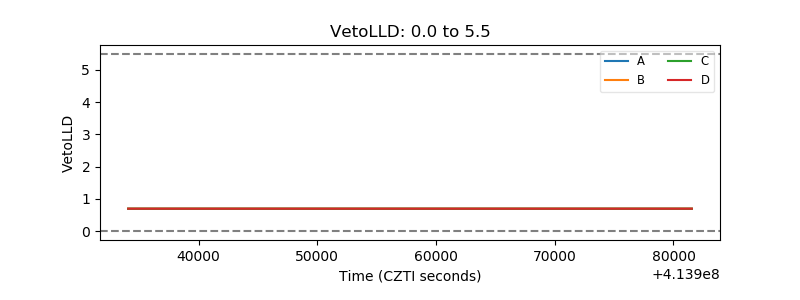 |
| Alpha Counter |  |
| _CPM_Rate | 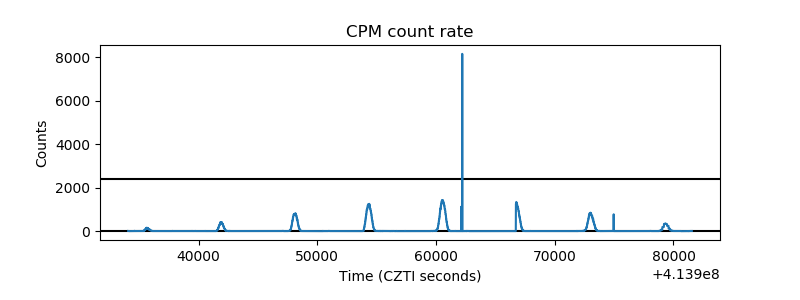 |
| CZT Counter |  |
| +2.5 Volts monitor |  |
| +5 Volts monitor | 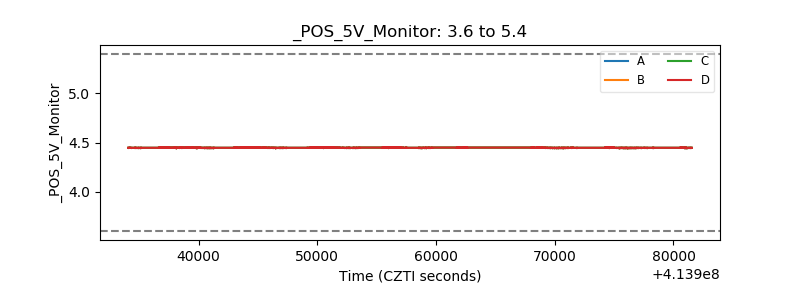 |
| _ROLL_ROT |  |
| _Roll_DEC |  |
| _Roll_RA |  |
| Veto Counter |  |