| Param | Original file | Final file |
|---|---|---|
| Filename | modeM0/AS1A12_044T09_9000005506cztM0_level2.fits | modeM0/AS1A12_044T09_9000005506cztM0_level2_quad_clean.evt |
| Size (bytes) | 265,921,920 | 324,100,800 |
| Size | 253.6 MB | 309.1 MB |
| Events in quadrant A | 1,589,432 | 2,027,816 |
| Events in quadrant B | 1,513,878 | 2,019,179 |
| Events in quadrant C | 1,564,200 | 1,961,997 |
| Events in quadrant D | 1,299,154 | 1,721,192 |
| Mode SS | |||
|---|---|---|---|
| Quadrant | BADHDUFLAG | Total packets | Discarded packets |
| A | 0 | 623 | 0 |
| B | 0 | 615 | 0 |
| C | 0 | 622 | 0 |
| D | 0 | 620 | 0 |
| Mode M9 | |||
|---|---|---|---|
| Quadrant | BADHDUFLAG | Total packets | Discarded packets |
| A | 0 | 108 | 0 |
| B | 0 | 108 | 0 |
| C | 0 | 108 | 0 |
| D | 0 | 106 | 0 |
| Mode M0 | |||
|---|---|---|---|
| Quadrant | BADHDUFLAG | Total packets | Discarded packets |
| A | 0 | 68778 | 0 |
| B | 0 | 66674 | 0 |
| C | 0 | 62002 | 0 |
| D | 0 | 88970 | 0 |
| Quadrant | Total seconds | Saturated seconds | Saturation percentage |
|---|---|---|---|
| A | 30387 | 190 | 0.625267% |
| B | 30354 | 277 | 0.912565% |
| C | 30354 | 72 | 0.237201% |
| D | 30286 | 2505 | 8.271148% |
Noise dominated data is calculated using 1-second bins in cleaned event files. If a bin has >2000 counts, and if more than 50% of those come from <1% of pixels, then it is considered to be noise-dominated and hence unusable.
| Quadrant | # 1 sec bins | Bins with >0 counts | Bins with >2000 counts | High rate bins dominated by noise | Noise dominated (total time) | Noise dominated (detector-on time) | Marked lightcurve |
|---|---|---|---|---|---|---|---|
| A | 41526 | 30510 | 0 | 0 | 0.00% | 0.00% |  |
| B | 41526 | 30500 | 0 | 0 | 0.00% | 0.00% |  |
| C | 41526 | 30495 | 0 | 0 | 0.00% | 0.00% |  |
| D | 41525 | 30279 | 0 | 0 | 0.00% | 0.00% |  |
Top three noisy pixels from each quadrant. If the there are fewer than three noisy pixels in the level2.evt file, extra rows are filled as -1
| Pixel properties | Quadrant properties | ||||||
|---|---|---|---|---|---|---|---|
| Quadrant | DetID | PixID | Counts | Sigma | Mean | Median | Sigma |
| A | 0 | 29 | 1326 | 8.93 | 414 | 388 | 105.1 |
| A | 9 | 19 | 1273 | 8.42 | 414 | 388 | 105.1 |
| A | 7 | 110 | 1272 | 8.41 | 414 | 388 | 105.1 |
| B | 2 | 9 | 1271 | 11.02 | 400 | 380 | 80.9 |
| B | 3 | 80 | 1165 | 9.71 | 400 | 380 | 80.9 |
| B | 3 | 17 | 1071 | 8.55 | 400 | 380 | 80.9 |
| C | 3 | 203 | 1330 | 8.7 | 413 | 386 | 108.6 |
| C | 1 | 81 | 1299 | 8.41 | 413 | 386 | 108.6 |
| C | 1 | 80 | 1279 | 8.23 | 413 | 386 | 108.6 |
| D | 7 | 3 | 1020 | 6.76 | 370 | 336 | 101.1 |
| D | 1 | 3 | 983 | 6.4 | 370 | 336 | 101.1 |
| D | 4 | 160 | 955 | 6.12 | 370 | 336 | 101.1 |
Histogram calculated using DETX and DETY for each event in the final _common_clean file
| Quadrant A | 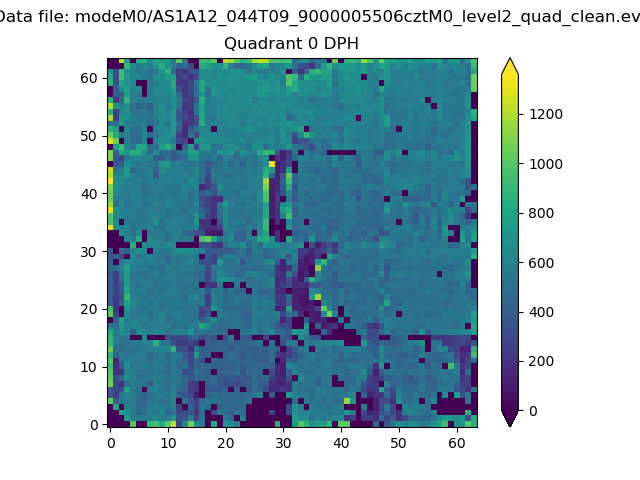 |
 |
Quadrant B |
|---|---|---|---|
| Quadrant D |  |
 |
Quadrant C |
| Plot type | Count rate plots | Images |
|---|---|---|
| Comparison with Poisson distribution Blue bars denote a histogram of data divided into 1 sec bins. Red curve is a Poisson curve with rate = median count rate of data. |
 |
 |
| Quadrant-wise count rates Data is divided into 100 sec bins |
 |
|
| Module-wise count rates for Quadrant A Data is divided into 100 sec bins |
 |
 |
| Module-wise count rates for Quadrant B Data is divided into 100 sec bins |
 |
 |
| Module-wise count rates for Quadrant C Data is divided into 100 sec bins |
 |
 |
| Module-wise count rates for Quadrant D Data is divided into 100 sec bins |
 |
 |
| Parameter | Plot |
|---|---|
| CZT HV Monitor |  |
| D_VDD |  |
| Temperature 1 |  |
| Veto HV Monitor |  |
| Veto LLD |  |
| Alpha Counter |  |
| _CPM_Rate |  |
| CZT Counter |  |
| +2.5 Volts monitor |  |
| +5 Volts monitor |  |
| _ROLL_ROT |  |
| _Roll_DEC |  |
| _Roll_RA |  |
| Veto Counter |  |