| Param | Original file | Final file |
|---|---|---|
| Filename | modeM0/AS1A12_068T03_9000005508cztM0_level2.fits | modeM0/AS1A12_068T03_9000005508cztM0_level2_quad_clean.evt |
| Size (bytes) | 371,079,360 | 354,185,280 |
| Size | 353.9 MB | 337.8 MB |
| Events in quadrant A | 2,205,882 | 2,024,931 |
| Events in quadrant B | 2,144,906 | 2,076,193 |
| Events in quadrant C | 2,203,546 | 2,010,158 |
| Events in quadrant D | 1,842,694 | 1,775,516 |
| Mode M9 | |||
|---|---|---|---|
| Quadrant | BADHDUFLAG | Total packets | Discarded packets |
| A | 0 | 186 | 0 |
| B | 0 | 187 | 0 |
| C | 0 | 187 | 0 |
| D | 0 | 191 | 0 |
| Mode M0 | |||
|---|---|---|---|
| Quadrant | BADHDUFLAG | Total packets | Discarded packets |
| A | 0 | 96537 | 0 |
| B | 0 | 88554 | 0 |
| C | 0 | 89264 | 0 |
| D | 0 | 120491 | 0 |
| Mode SS | |||
|---|---|---|---|
| Quadrant | BADHDUFLAG | Total packets | Discarded packets |
| A | 0 | 849 | 0 |
| B | 0 | 851 | 0 |
| C | 0 | 848 | 0 |
| D | 0 | 851 | 0 |
| Quadrant | Total seconds | Saturated seconds | Saturation percentage |
|---|---|---|---|
| A | 41248 | 1047 | 2.538305% |
| B | 41412 | 242 | 0.584372% |
| C | 41369 | 367 | 0.887138% |
| D | 41344 | 3229 | 7.810081% |
Noise dominated data is calculated using 1-second bins in cleaned event files. If a bin has >2000 counts, and if more than 50% of those come from <1% of pixels, then it is considered to be noise-dominated and hence unusable.
| Quadrant | # 1 sec bins | Bins with >0 counts | Bins with >2000 counts | High rate bins dominated by noise | Noise dominated (total time) | Noise dominated (detector-on time) | Marked lightcurve |
|---|---|---|---|---|---|---|---|
| A | 93296 | 41452 | 0 | 0 | 0.00% | 0.00% |  |
| B | 93298 | 41589 | 0 | 0 | 0.00% | 0.00% |  |
| C | 93298 | 41548 | 0 | 0 | 0.00% | 0.00% |  |
| D | 93298 | 41402 | 0 | 0 | 0.00% | 0.00% | 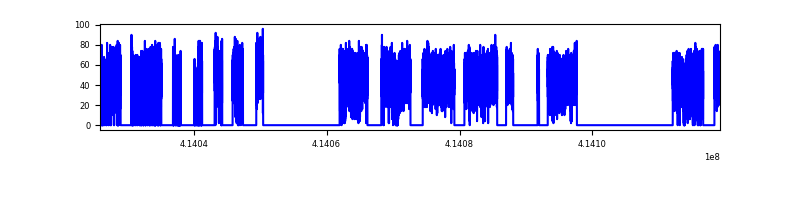 |
Top three noisy pixels from each quadrant. If the there are fewer than three noisy pixels in the level2.evt file, extra rows are filled as -1
| Pixel properties | Quadrant properties | ||||||
|---|---|---|---|---|---|---|---|
| Quadrant | DetID | PixID | Counts | Sigma | Mean | Median | Sigma |
| A | 7 | 110 | 1802 | 8.65 | 575 | 539 | 146.0 |
| A | 0 | 29 | 1795 | 8.61 | 575 | 539 | 146.0 |
| A | 9 | 19 | 1778 | 8.49 | 575 | 539 | 146.0 |
| B | 2 | 9 | 1893 | 11.93 | 568 | 541 | 113.3 |
| B | 3 | 80 | 1637 | 9.67 | 568 | 541 | 113.3 |
| B | 2 | 8 | 1511 | 8.56 | 568 | 541 | 113.3 |
| C | 1 | 81 | 1812 | 8.46 | 582 | 543 | 150.0 |
| C | 1 | 80 | 1804 | 8.41 | 582 | 543 | 150.0 |
| C | 3 | 203 | 1769 | 8.17 | 582 | 543 | 150.0 |
| D | 10 | 189 | 1409 | 6.59 | 526 | 479 | 141.0 |
| D | 7 | 3 | 1367 | 6.3 | 526 | 479 | 141.0 |
| D | 6 | 231 | 1352 | 6.19 | 526 | 479 | 141.0 |
Histogram calculated using DETX and DETY for each event in the final _common_clean file
| Quadrant A | 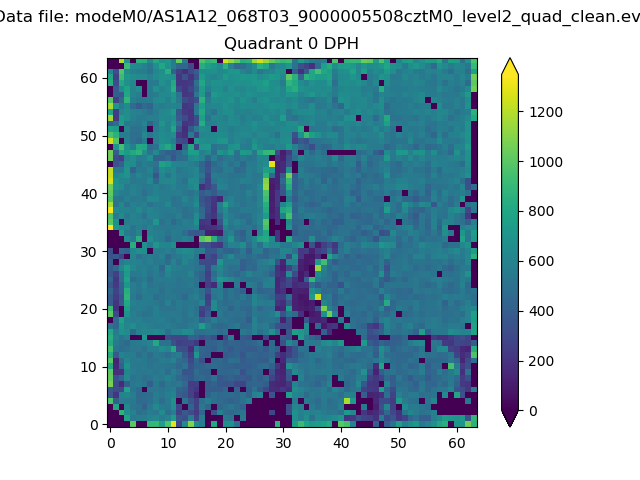 |
 |
Quadrant B |
|---|---|---|---|
| Quadrant D |  |
 |
Quadrant C |
| Plot type | Count rate plots | Images |
|---|---|---|
| Comparison with Poisson distribution Blue bars denote a histogram of data divided into 1 sec bins. Red curve is a Poisson curve with rate = median count rate of data. |
 |
 |
| Quadrant-wise count rates Data is divided into 100 sec bins |
 |
|
| Module-wise count rates for Quadrant A Data is divided into 100 sec bins |
 |
 |
| Module-wise count rates for Quadrant B Data is divided into 100 sec bins |
 |
 |
| Module-wise count rates for Quadrant C Data is divided into 100 sec bins |
 |
 |
| Module-wise count rates for Quadrant D Data is divided into 100 sec bins |
 |
 |
| Parameter | Plot |
|---|---|
| CZT HV Monitor |  |
| D_VDD |  |
| Temperature 1 |  |
| Veto HV Monitor |  |
| Veto LLD |  |
| Alpha Counter |  |
| _CPM_Rate |  |
| CZT Counter |  |
| +2.5 Volts monitor |  |
| +5 Volts monitor |  |
| _ROLL_ROT |  |
| _Roll_DEC |  |
| _Roll_RA |  |
| Veto Counter |  |