| Param | Original file | Final file |
|---|---|---|
| Filename | modeM0/AS1A12_044T21_9000005512cztM0_level2.fits | modeM0/AS1A12_044T21_9000005512cztM0_level2_quad_clean.evt |
| Size (bytes) | 297,120,960 | 260,542,080 |
| Size | 283.4 MB | 248.5 MB |
| Events in quadrant A | 1,823,778 | 1,556,834 |
| Events in quadrant B | 1,736,718 | 1,548,189 |
| Events in quadrant C | 1,656,266 | 1,225,657 |
| Events in quadrant D | 1,478,998 | 1,259,685 |
| Mode M9 | |||
|---|---|---|---|
| Quadrant | BADHDUFLAG | Total packets | Discarded packets |
| A | 0 | 164 | 0 |
| B | 0 | 164 | 0 |
| C | 0 | 164 | 0 |
| D | 0 | 164 | 0 |
| Mode SS | |||
|---|---|---|---|
| Quadrant | BADHDUFLAG | Total packets | Discarded packets |
| A | 0 | 754 | 0 |
| B | 0 | 755 | 0 |
| C | 0 | 755 | 0 |
| D | 0 | 756 | 0 |
| Mode M0 | |||
|---|---|---|---|
| Quadrant | BADHDUFLAG | Total packets | Discarded packets |
| A | 0 | 74148 | 0 |
| B | 0 | 79039 | 0 |
| C | 0 | 128327 | 0 |
| D | 0 | 101041 | 0 |
| Quadrant | Total seconds | Saturated seconds | Saturation percentage |
|---|---|---|---|
| A | 33287 | 211 | 0.633881% |
| B | 33267 | 846 | 2.543061% |
| C | 33149 | 5079 | 15.321729% |
| D | 33140 | 3014 | 9.094750% |
Noise dominated data is calculated using 1-second bins in cleaned event files. If a bin has >2000 counts, and if more than 50% of those come from <1% of pixels, then it is considered to be noise-dominated and hence unusable.
| Quadrant | # 1 sec bins | Bins with >0 counts | Bins with >2000 counts | High rate bins dominated by noise | Noise dominated (total time) | Noise dominated (detector-on time) | Marked lightcurve |
|---|---|---|---|---|---|---|---|
| A | 52160 | 33340 | 0 | 0 | 0.00% | 0.00% |  |
| B | 52160 | 33331 | 0 | 0 | 0.00% | 0.00% |  |
| C | 52159 | 33225 | 0 | 0 | 0.00% | 0.00% |  |
| D | 52160 | 33107 | 0 | 0 | 0.00% | 0.00% |  |
Top three noisy pixels from each quadrant. If the there are fewer than three noisy pixels in the level2.evt file, extra rows are filled as -1
| Pixel properties | Quadrant properties | ||||||
|---|---|---|---|---|---|---|---|
| Quadrant | DetID | PixID | Counts | Sigma | Mean | Median | Sigma |
| A | 0 | 29 | 1472 | 8.59 | 476 | 448 | 119.2 |
| A | 9 | 19 | 1469 | 8.57 | 476 | 448 | 119.2 |
| A | 7 | 110 | 1431 | 8.25 | 476 | 448 | 119.2 |
| B | 2 | 9 | 1479 | 11.45 | 459 | 438 | 90.9 |
| B | 3 | 80 | 1328 | 9.79 | 459 | 438 | 90.9 |
| B | 2 | 8 | 1241 | 8.83 | 459 | 438 | 90.9 |
| C | 1 | 81 | 1329 | 8.11 | 437 | 411 | 113.2 |
| C | 1 | 80 | 1303 | 7.88 | 437 | 411 | 113.2 |
| C | 3 | 203 | 1265 | 7.54 | 437 | 411 | 113.2 |
| D | 4 | 160 | 1117 | 6.43 | 422 | 385 | 113.8 |
| D | 7 | 3 | 1113 | 6.4 | 422 | 385 | 113.8 |
| D | 10 | 189 | 1101 | 6.29 | 422 | 385 | 113.8 |
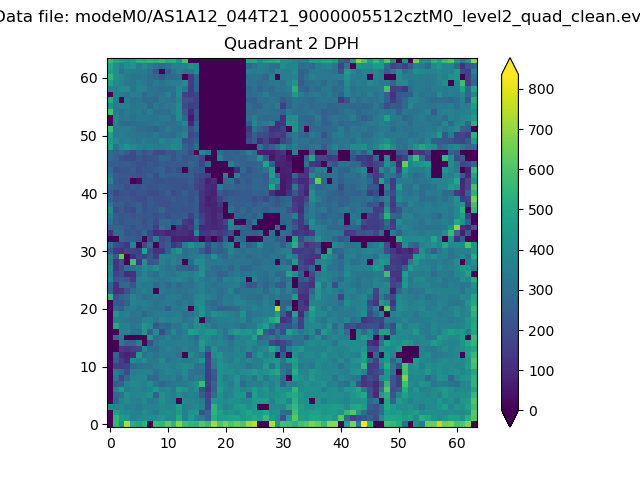
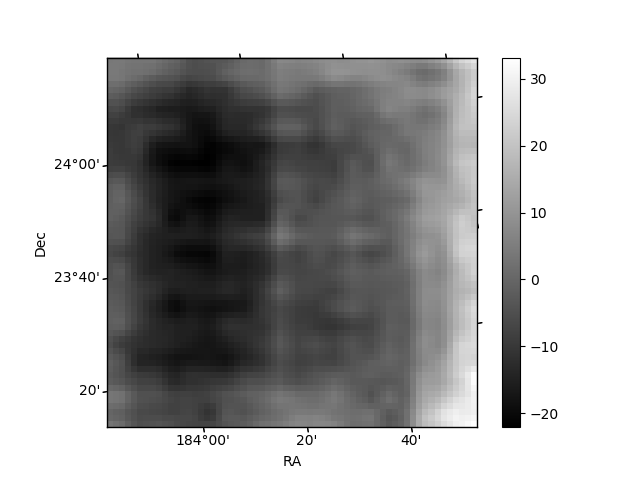
Histogram calculated using DETX and DETY for each event in the final _common_clean file
| Quadrant A | 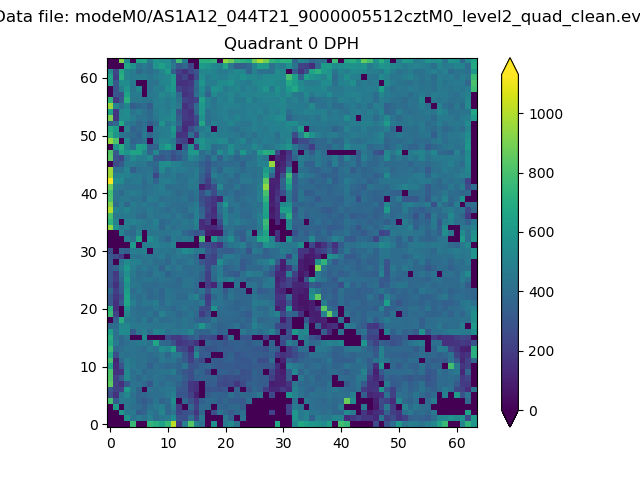 |
 |
Quadrant B |
|---|---|---|---|
| Quadrant D |  |
 |
Quadrant C |
| Plot type | Count rate plots | Images |
|---|---|---|
| Comparison with Poisson distribution Blue bars denote a histogram of data divided into 1 sec bins. Red curve is a Poisson curve with rate = median count rate of data. |
 |
 |
| Quadrant-wise count rates Data is divided into 100 sec bins |
 |
|
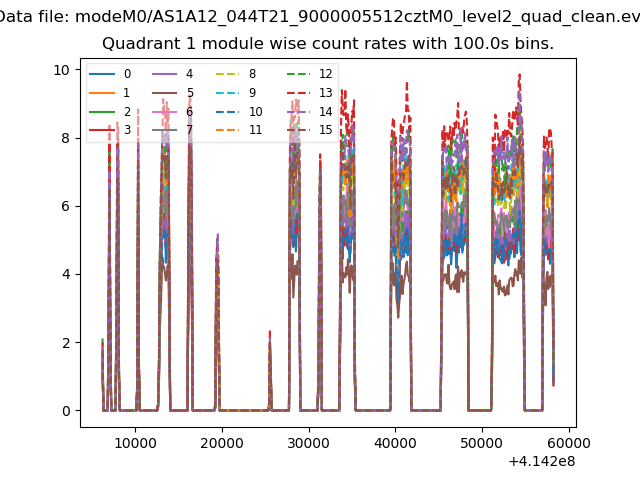
| Module-wise count rates for Quadrant A Data is divided into 100 sec bins |
 |
 |
| Module-wise count rates for Quadrant B Data is divided into 100 sec bins |
 |
 |
| Module-wise count rates for Quadrant C Data is divided into 100 sec bins |
 |
 |
| Module-wise count rates for Quadrant D Data is divided into 100 sec bins |
 |
 |
| Parameter | Plot |
|---|---|
| CZT HV Monitor |  |
| D_VDD |  |
| Temperature 1 | 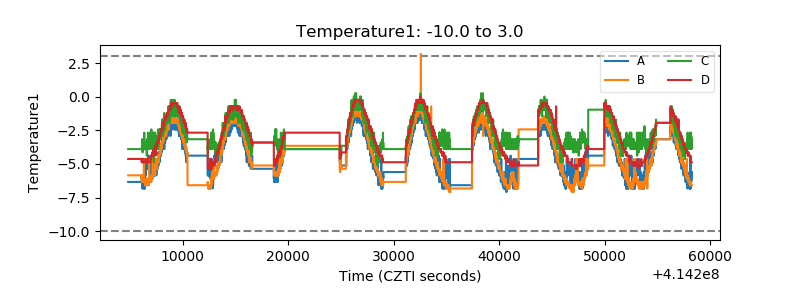 |
| Veto HV Monitor |  |
| Veto LLD |  |
| Alpha Counter |  |
| _CPM_Rate |  |
| CZT Counter |  |
| +2.5 Volts monitor |  |
| +5 Volts monitor |  |
| _ROLL_ROT |  |
| _Roll_DEC |  |
| _Roll_RA | 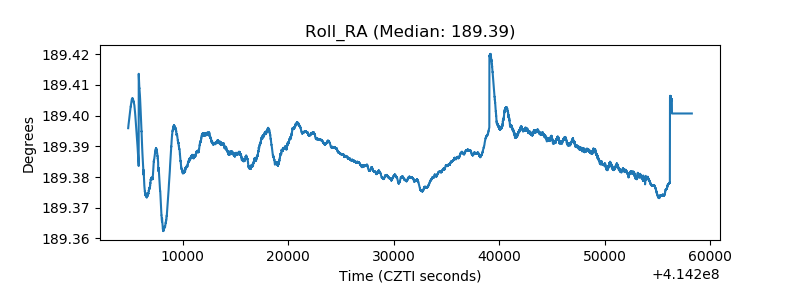 |
| Veto Counter |  |