| Param | Original file | Final file |
|---|---|---|
| Filename | modeM0/AS1A12_042T01_9000005522cztM0_level2.fits | modeM0/AS1A12_042T01_9000005522cztM0_level2_quad_clean.evt |
| Size (bytes) | 257,843,520 | 311,351,040 |
| Size | 245.9 MB | 296.9 MB |
| Events in quadrant A | 1,758,152 | 2,491,996 |
| Events in quadrant B | 1,691,212 | 2,496,748 |
| Events in quadrant C | 588,716 | 146,439 |
| Events in quadrant D | 1,423,088 | 1,963,033 |
| Mode SS | |||
|---|---|---|---|
| Quadrant | BADHDUFLAG | Total packets | Discarded packets |
| A | 0 | 688 | 0 |
| B | 0 | 688 | 0 |
| C | 0 | 688 | 0 |
| D | 0 | 688 | 0 |
| Mode M0 | |||
|---|---|---|---|
| Quadrant | BADHDUFLAG | Total packets | Discarded packets |
| A | 0 | 72872 | 0 |
| B | 0 | 71901 | 0 |
| C | 0 | 274098 | 0 |
| D | 0 | 107501 | 0 |
| Mode M9 | |||
|---|---|---|---|
| Quadrant | BADHDUFLAG | Total packets | Discarded packets |
| A | 0 | 116 | 0 |
| B | 0 | 116 | 0 |
| C | 0 | 116 | 0 |
| D | 0 | 116 | 0 |
| Quadrant | Total seconds | Saturated seconds | Saturation percentage |
|---|---|---|---|
| A | 33936 | 99 | 0.291726% |
| B | 33936 | 125 | 0.368340% |
| C | 33936 | 32275 | 95.105493% |
| D | 33936 | 3159 | 9.308699% |
Noise dominated data is calculated using 1-second bins in cleaned event files. If a bin has >2000 counts, and if more than 50% of those come from <1% of pixels, then it is considered to be noise-dominated and hence unusable.
| Quadrant | # 1 sec bins | Bins with >0 counts | Bins with >2000 counts | High rate bins dominated by noise | Noise dominated (total time) | Noise dominated (detector-on time) | Marked lightcurve |
|---|---|---|---|---|---|---|---|
| A | 45347 | 33931 | 0 | 0 | 0.00% | 0.00% | 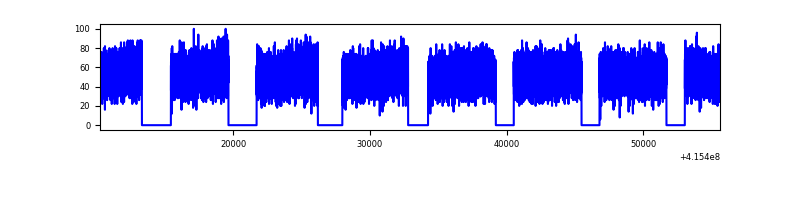 |
| B | 45347 | 33934 | 0 | 0 | 0.00% | 0.00% |  |
| C | 45346 | 32727 | 0 | 0 | 0.00% | 0.00% | 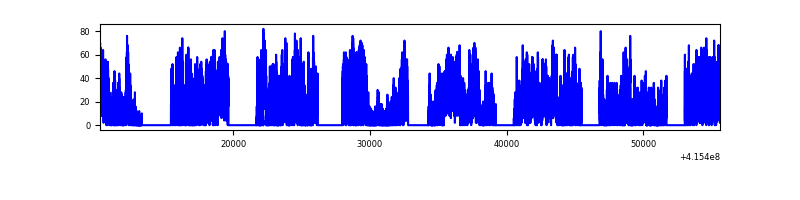 |
| D | 45346 | 33782 | 0 | 0 | 0.00% | 0.00% | 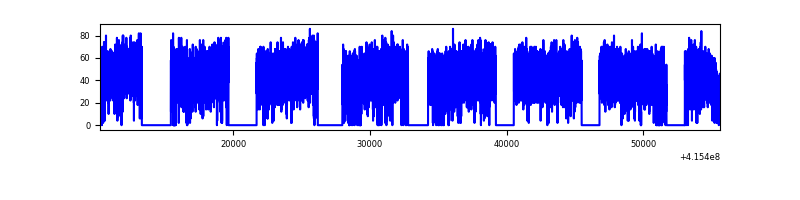 |
Top three noisy pixels from each quadrant. If the there are fewer than three noisy pixels in the level2.evt file, extra rows are filled as -1
| Pixel properties | Quadrant properties | ||||||
|---|---|---|---|---|---|---|---|
| Quadrant | DetID | PixID | Counts | Sigma | Mean | Median | Sigma |
| A | 0 | 29 | 1460 | 8.78 | 458 | 430 | 117.3 |
| A | 9 | 19 | 1453 | 8.72 | 458 | 430 | 117.3 |
| A | 7 | 110 | 1402 | 8.29 | 458 | 430 | 117.3 |
| B | 2 | 9 | 1449 | 11.28 | 448 | 427 | 90.6 |
| B | 3 | 80 | 1239 | 8.96 | 448 | 427 | 90.6 |
| B | 3 | 17 | 1212 | 8.66 | 448 | 427 | 90.6 |
| C | 3 | 202 | 503 | 8.24 | 155 | 147 | 43.2 |
| C | 1 | 81 | 493 | 8.01 | 155 | 147 | 43.2 |
| C | 1 | 80 | 483 | 7.78 | 155 | 147 | 43.2 |
| D | 4 | 160 | 1071 | 6.35 | 406 | 369 | 110.5 |
| D | 7 | 3 | 1068 | 6.33 | 406 | 369 | 110.5 |
| D | 10 | 189 | 1063 | 6.28 | 406 | 369 | 110.5 |
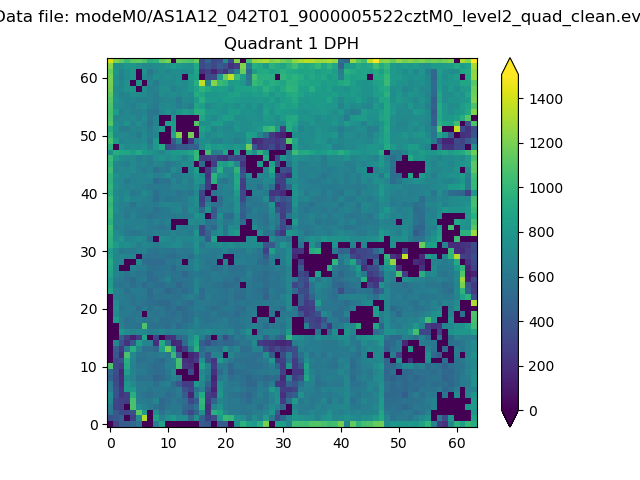
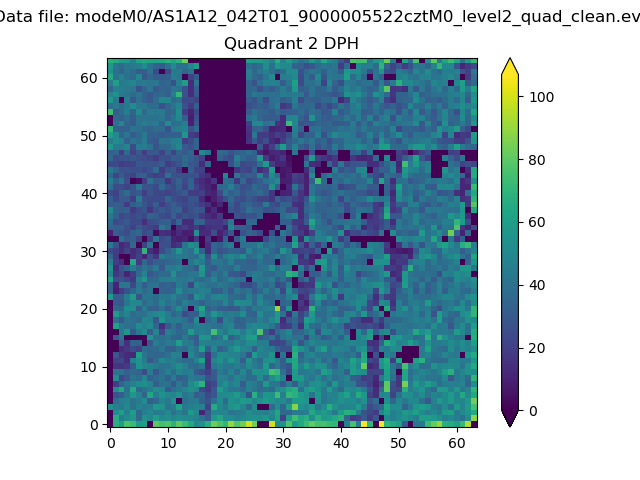
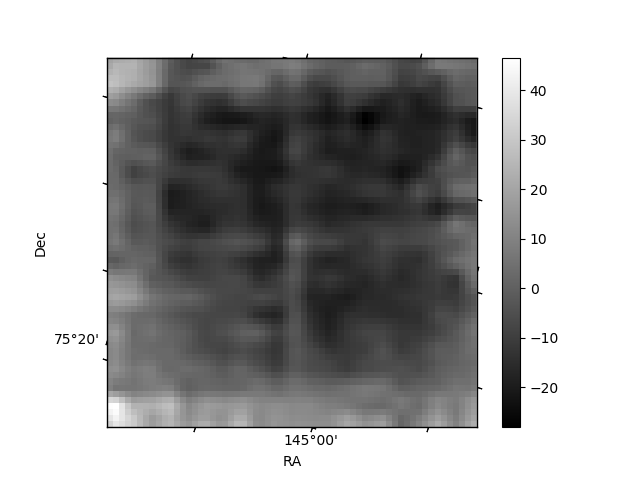
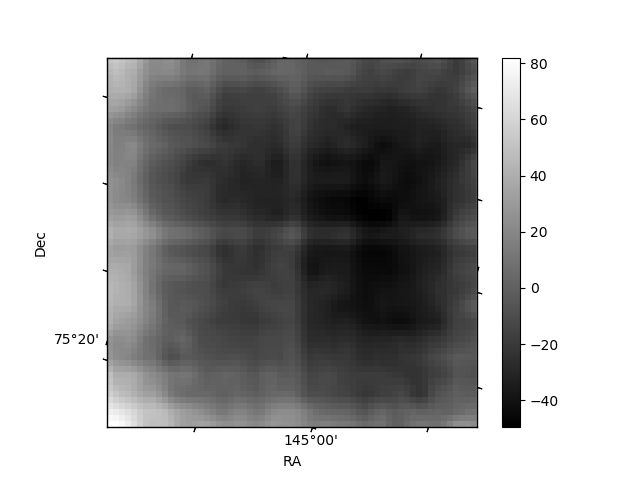
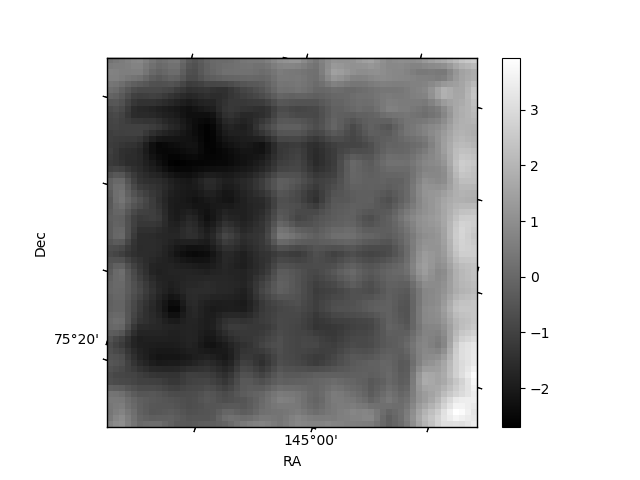
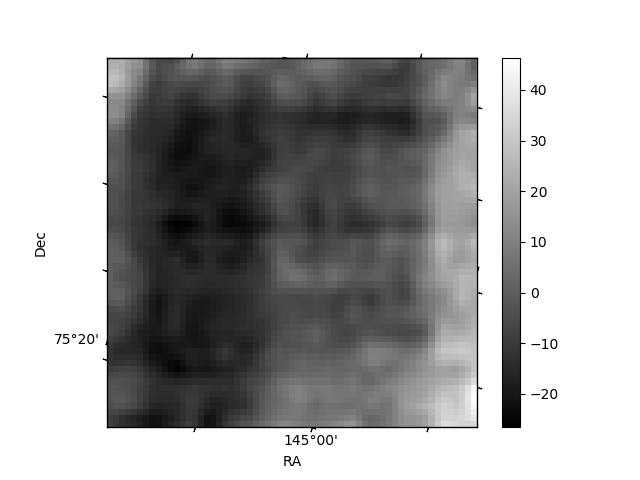
Histogram calculated using DETX and DETY for each event in the final _common_clean file
| Quadrant A | 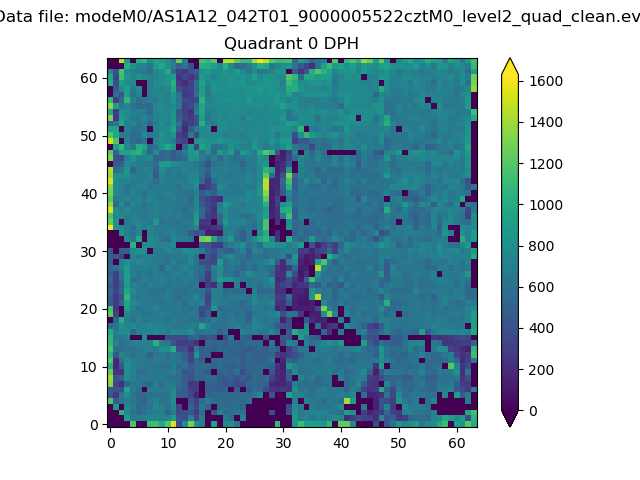 |
 |
Quadrant B |
|---|---|---|---|
| Quadrant D | 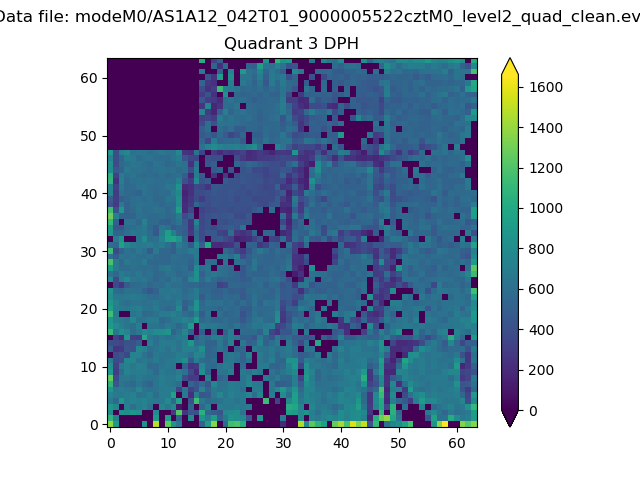 |
 |
Quadrant C |
| Plot type | Count rate plots | Images |
|---|---|---|
| Comparison with Poisson distribution Blue bars denote a histogram of data divided into 1 sec bins. Red curve is a Poisson curve with rate = median count rate of data. |
 |
 |
| Quadrant-wise count rates Data is divided into 100 sec bins |
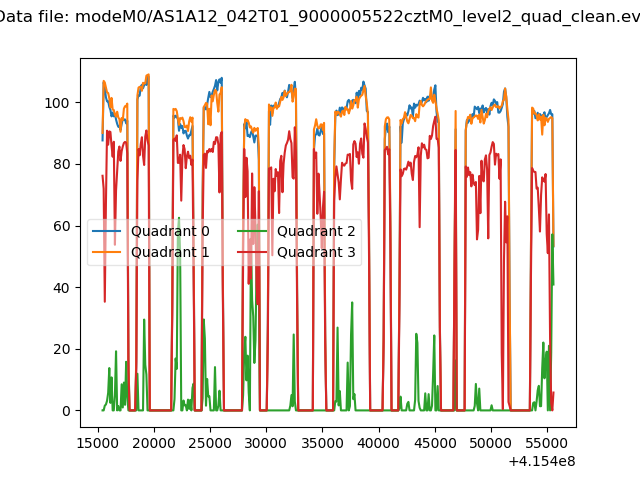 |
|
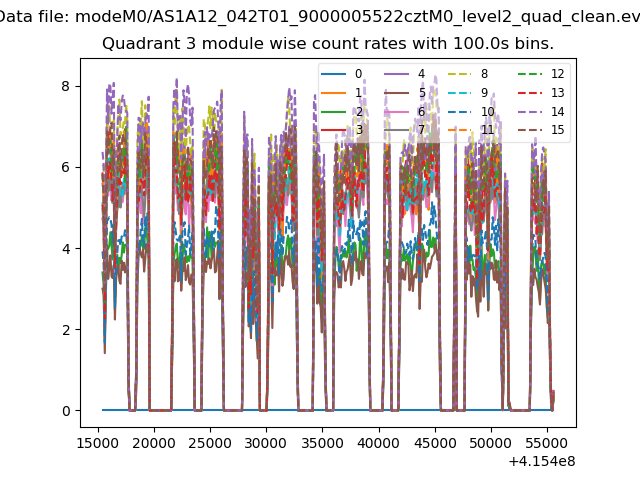
| Module-wise count rates for Quadrant A Data is divided into 100 sec bins |
 |
 |
| Module-wise count rates for Quadrant B Data is divided into 100 sec bins |
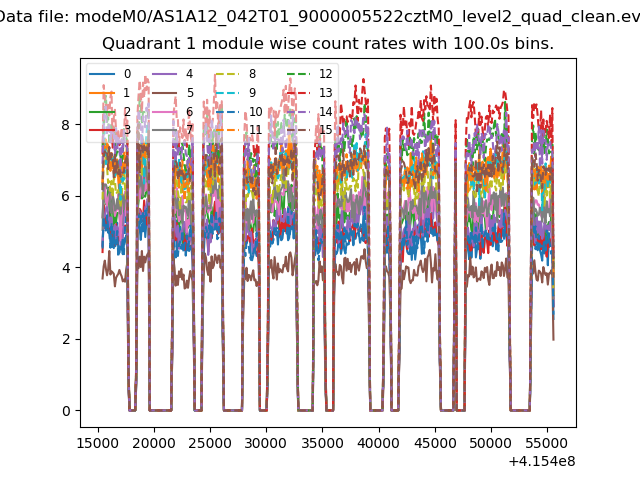 |
 |
| Module-wise count rates for Quadrant C Data is divided into 100 sec bins |
 |
 |
| Module-wise count rates for Quadrant D Data is divided into 100 sec bins |
 |
 |
| Parameter | Plot |
|---|---|
| CZT HV Monitor | 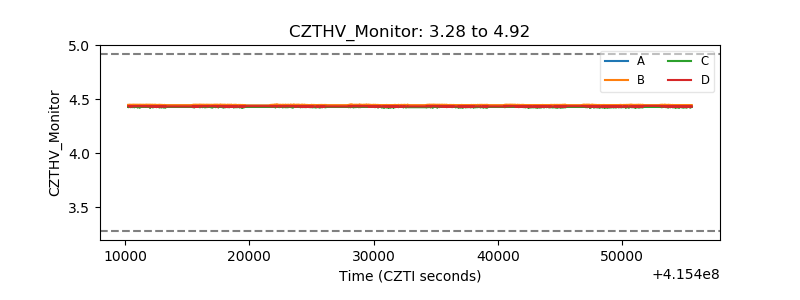 |
| D_VDD | 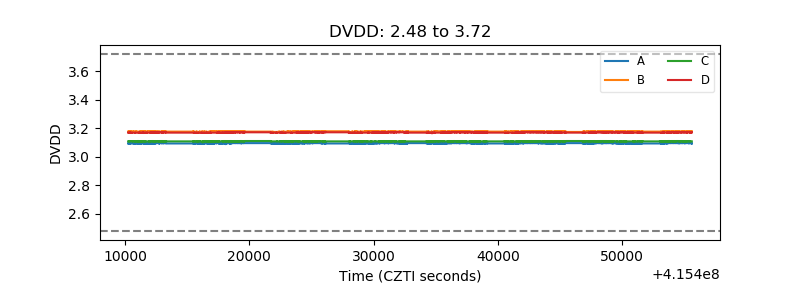 |
| Temperature 1 | 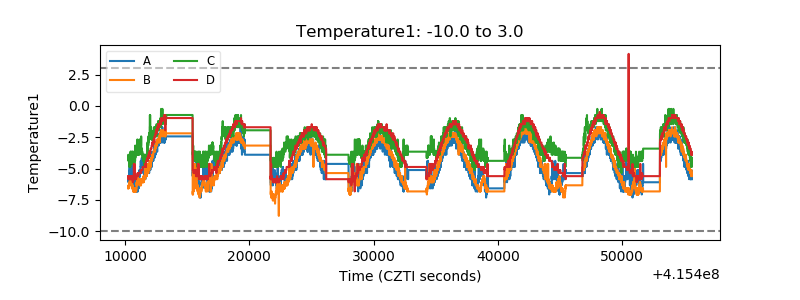 |
| Veto HV Monitor | 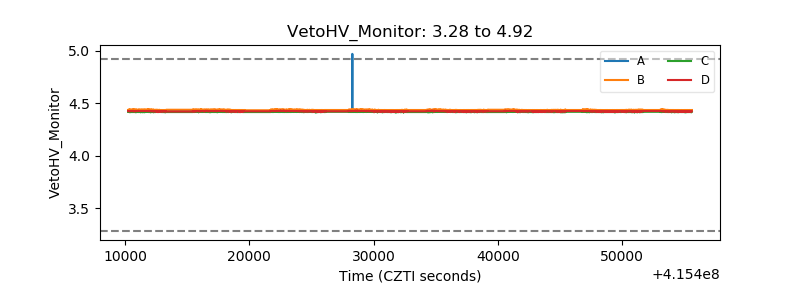 |
| Veto LLD | 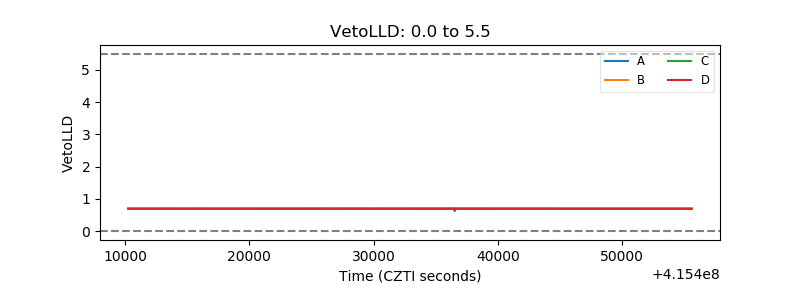 |
| Alpha Counter | 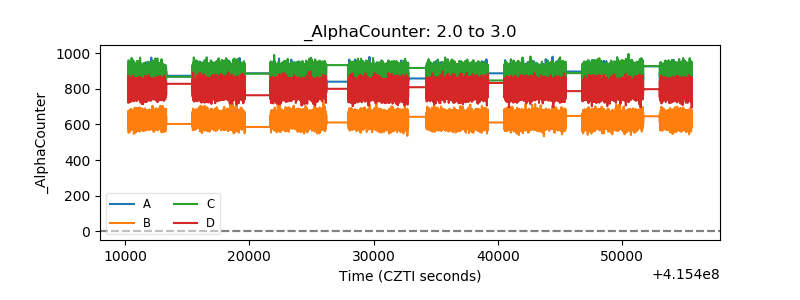 |
| _CPM_Rate | 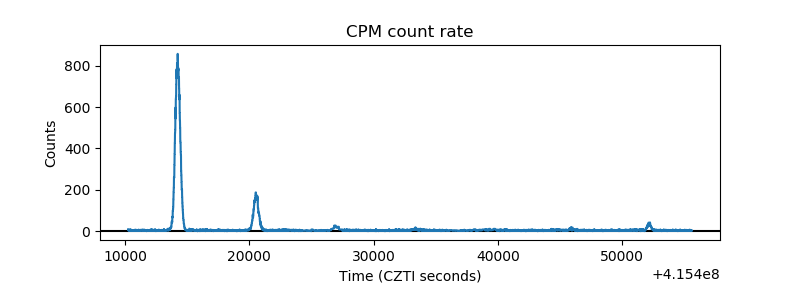 |
| CZT Counter |  |
| +2.5 Volts monitor | 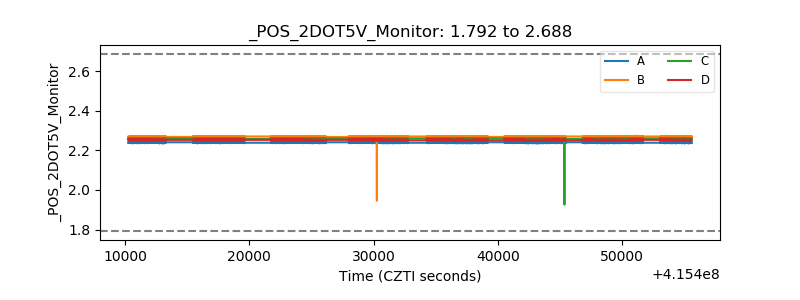 |
| +5 Volts monitor | 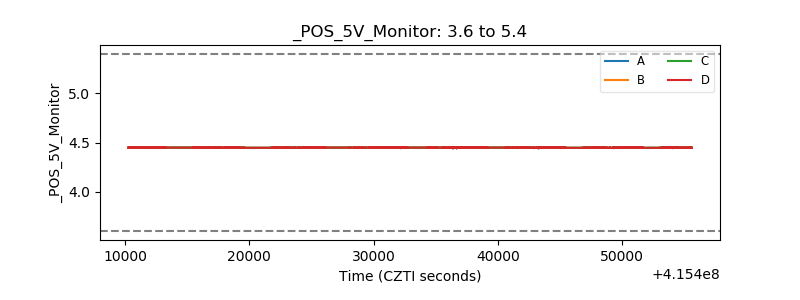 |
| _ROLL_ROT | 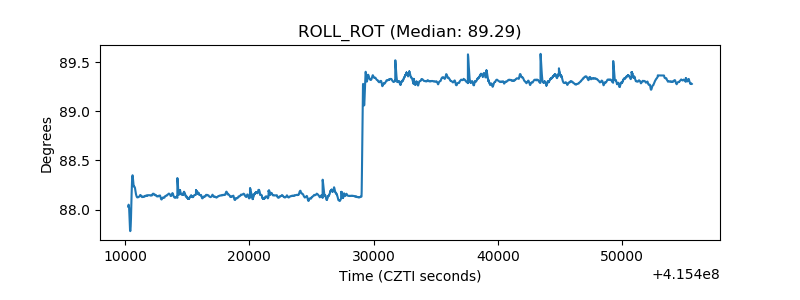 |
| _Roll_DEC | 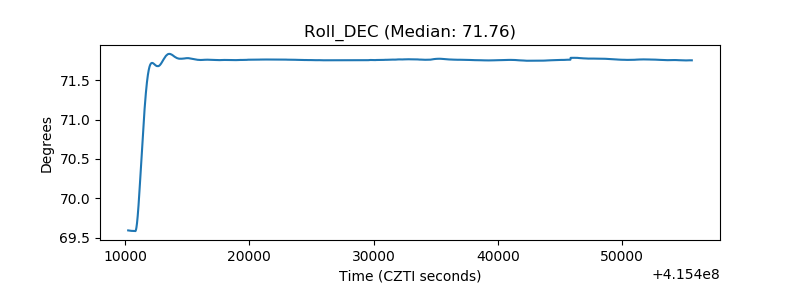 |
| _Roll_RA |  |
| Veto Counter | 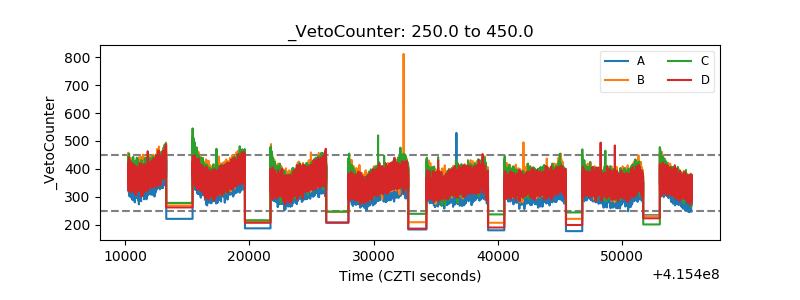 |