| Param | Original file | Final file |
|---|---|---|
| Filename | modeM0/AS1A12_032T04_9000005528cztM0_level2.fits | modeM0/AS1A12_032T04_9000005528cztM0_level2_quad_clean.evt |
| Size (bytes) | 728,334,720 | 824,921,280 |
| Size | 694.6 MB | 786.7 MB |
| Events in quadrant A | 4,489,086 | 5,350,030 |
| Events in quadrant B | 4,308,292 | 5,406,880 |
| Events in quadrant C | 3,790,522 | 4,044,886 |
| Events in quadrant D | 3,632,180 | 4,358,526 |
| Mode SS | |||
|---|---|---|---|
| Quadrant | BADHDUFLAG | Total packets | Discarded packets |
| A | 0 | 1732 | 0 |
| B | 0 | 1732 | 0 |
| C | 0 | 1732 | 0 |
| D | 0 | 1732 | 0 |
| Mode M0 | |||
|---|---|---|---|
| Quadrant | BADHDUFLAG | Total packets | Discarded packets |
| A | 0 | 188016 | 0 |
| B | 0 | 186861 | 0 |
| C | 0 | 372335 | 0 |
| D | 0 | 265428 | 0 |
| Mode M9 | |||
|---|---|---|---|
| Quadrant | BADHDUFLAG | Total packets | Discarded packets |
| A | 0 | 314 | 0 |
| B | 0 | 314 | 0 |
| C | 0 | 314 | 0 |
| D | 0 | 315 | 0 |
| Quadrant | Total seconds | Saturated seconds | Saturation percentage |
|---|---|---|---|
| A | 84943 | 747 | 0.879413% |
| B | 84943 | 1372 | 1.615201% |
| C | 84943 | 22936 | 27.001636% |
| D | 84943 | 7697 | 9.061371% |
Noise dominated data is calculated using 1-second bins in cleaned event files. If a bin has >2000 counts, and if more than 50% of those come from <1% of pixels, then it is considered to be noise-dominated and hence unusable.
| Quadrant | # 1 sec bins | Bins with >0 counts | Bins with >2000 counts | High rate bins dominated by noise | Noise dominated (total time) | Noise dominated (detector-on time) | Marked lightcurve |
|---|---|---|---|---|---|---|---|
| A | 130871 | 84942 | 0 | 0 | 0.00% | 0.00% | 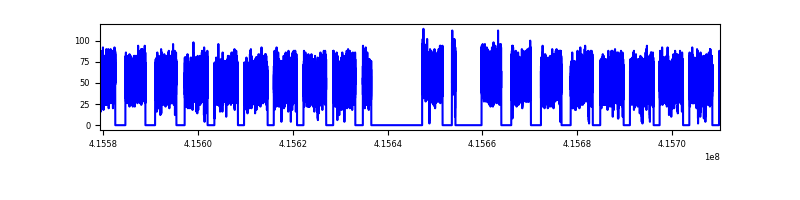 |
| B | 130872 | 84936 | 0 | 0 | 0.00% | 0.00% |  |
| C | 130872 | 84745 | 0 | 0 | 0.00% | 0.00% |  |
| D | 130871 | 84777 | 0 | 0 | 0.00% | 0.00% |  |
Top three noisy pixels from each quadrant. If the there are fewer than three noisy pixels in the level2.evt file, extra rows are filled as -1
| Pixel properties | Quadrant properties | ||||||
|---|---|---|---|---|---|---|---|
| Quadrant | DetID | PixID | Counts | Sigma | Mean | Median | Sigma |
| A | 9 | 19 | 3707 | 8.96 | 1169 | 1096 | 291.3 |
| A | 7 | 110 | 3701 | 8.94 | 1169 | 1096 | 291.3 |
| A | 0 | 29 | 3588 | 8.56 | 1169 | 1096 | 291.3 |
| B | 2 | 9 | 3684 | 11.79 | 1141 | 1089 | 220.2 |
| B | 3 | 80 | 3300 | 10.04 | 1141 | 1089 | 220.2 |
| B | 3 | 17 | 3025 | 8.79 | 1141 | 1089 | 220.2 |
| C | 1 | 81 | 3254 | 9.03 | 1002 | 939 | 256.4 |
| C | 3 | 202 | 3104 | 8.44 | 1002 | 939 | 256.4 |
| C | 3 | 203 | 3068 | 8.3 | 1002 | 939 | 256.4 |
| D | 10 | 189 | 2760 | 6.58 | 1038 | 945 | 275.7 |
| D | 7 | 3 | 2686 | 6.31 | 1038 | 945 | 275.7 |
| D | 6 | 62 | 2646 | 6.17 | 1038 | 945 | 275.7 |
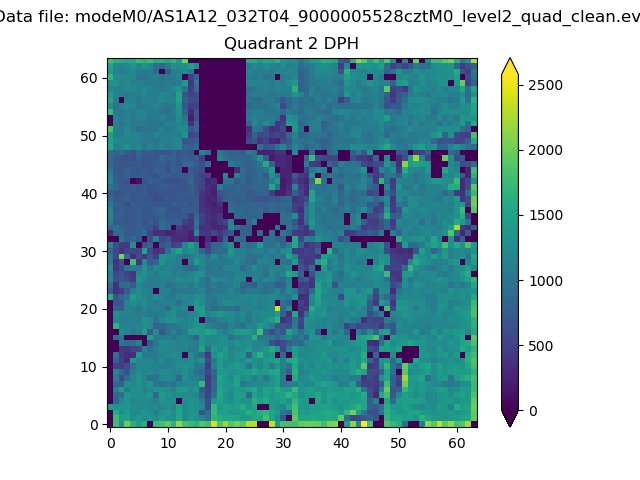
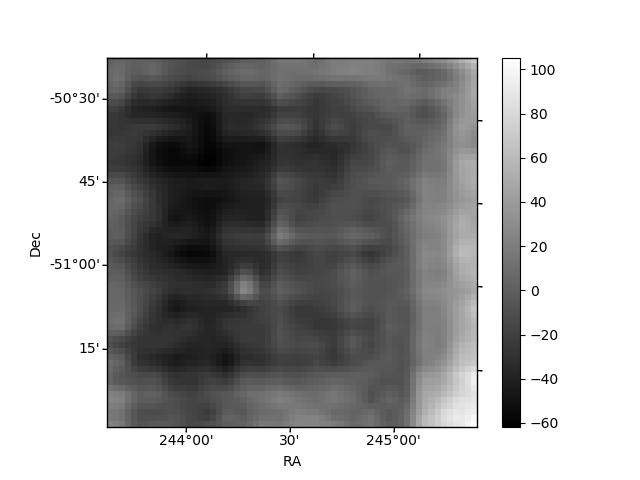
Histogram calculated using DETX and DETY for each event in the final _common_clean file
| Quadrant A |  |
 |
Quadrant B |
|---|---|---|---|
| Quadrant D | 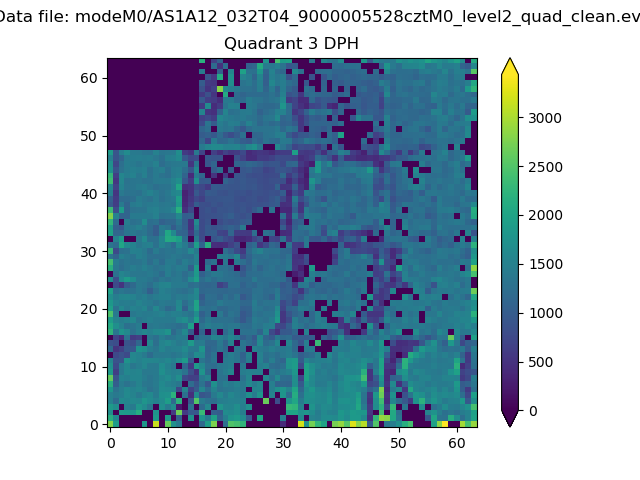 |
 |
Quadrant C |
| Plot type | Count rate plots | Images |
|---|---|---|
| Comparison with Poisson distribution Blue bars denote a histogram of data divided into 1 sec bins. Red curve is a Poisson curve with rate = median count rate of data. |
 |
 |
| Quadrant-wise count rates Data is divided into 100 sec bins |
 |
|
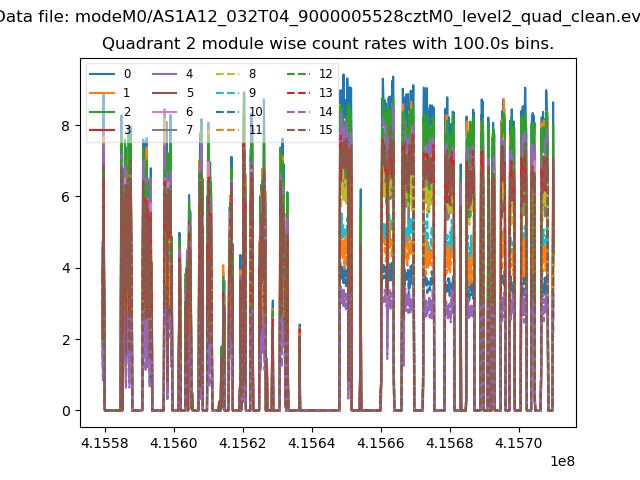
| Module-wise count rates for Quadrant A Data is divided into 100 sec bins |
 |
 |
| Module-wise count rates for Quadrant B Data is divided into 100 sec bins |
 |
 |
| Module-wise count rates for Quadrant C Data is divided into 100 sec bins |
 |
 |
| Module-wise count rates for Quadrant D Data is divided into 100 sec bins |
 |
 |
| Parameter | Plot |
|---|---|
| CZT HV Monitor |  |
| D_VDD | 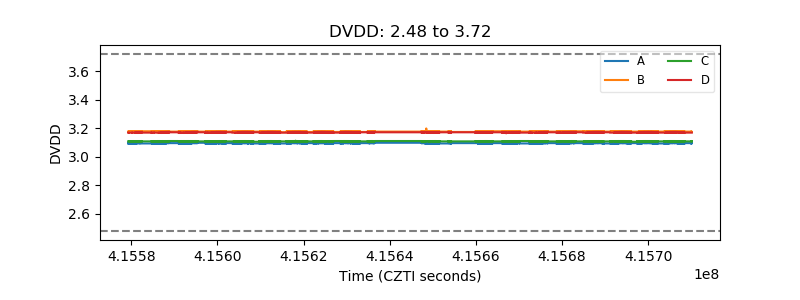 |
| Temperature 1 |  |
| Veto HV Monitor |  |
| Veto LLD |  |
| Alpha Counter |  |
| _CPM_Rate |  |
| CZT Counter |  |
| +2.5 Volts monitor |  |
| +5 Volts monitor | 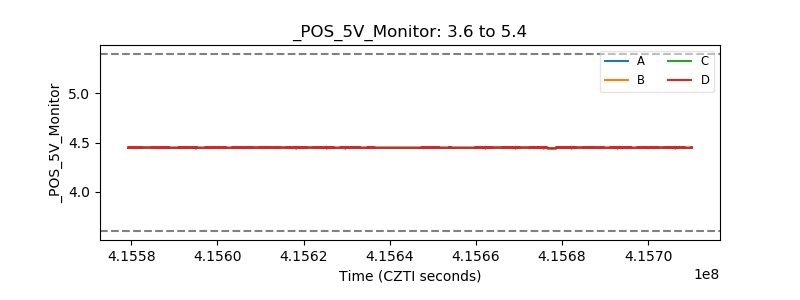 |
| _ROLL_ROT |  |
| _Roll_DEC |  |
| _Roll_RA |  |
| Veto Counter | 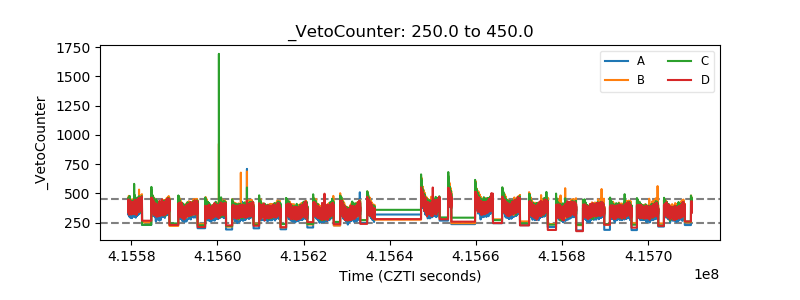 |