| Param | Original file | Final file |
|---|---|---|
| Filename | modeM0/AS1A12_022T01_9000005536cztM0_level2.fits | modeM0/AS1A12_022T01_9000005536cztM0_level2_quad_clean.evt |
| Size (bytes) | 482,590,080 | 559,068,480 |
| Size | 460.2 MB | 533.2 MB |
| Events in quadrant A | 2,865,582 | 3,464,068 |
| Events in quadrant B | 2,805,502 | 3,507,669 |
| Events in quadrant C | 2,890,080 | 3,400,873 |
| Events in quadrant D | 2,374,306 | 2,881,604 |
| Mode SS | |||
|---|---|---|---|
| Quadrant | BADHDUFLAG | Total packets | Discarded packets |
| A | 0 | 1094 | 0 |
| B | 0 | 1094 | 0 |
| C | 0 | 1094 | 0 |
| D | 0 | 1094 | 0 |
| Mode M0 | |||
|---|---|---|---|
| Quadrant | BADHDUFLAG | Total packets | Discarded packets |
| A | 0 | 124027 | 0 |
| B | 0 | 112686 | 0 |
| C | 0 | 114065 | 0 |
| D | 0 | 163549 | 0 |
| Mode M9 | |||
|---|---|---|---|
| Quadrant | BADHDUFLAG | Total packets | Discarded packets |
| A | 0 | 212 | 0 |
| B | 0 | 212 | 0 |
| C | 0 | 212 | 0 |
| D | 0 | 212 | 0 |
| Quadrant | Total seconds | Saturated seconds | Saturation percentage |
|---|---|---|---|
| A | 53609 | 902 | 1.682553% |
| B | 53609 | 327 | 0.609972% |
| C | 53609 | 264 | 0.492455% |
| D | 53609 | 4866 | 9.076834% |
Noise dominated data is calculated using 1-second bins in cleaned event files. If a bin has >2000 counts, and if more than 50% of those come from <1% of pixels, then it is considered to be noise-dominated and hence unusable.
| Quadrant | # 1 sec bins | Bins with >0 counts | Bins with >2000 counts | High rate bins dominated by noise | Noise dominated (total time) | Noise dominated (detector-on time) | Marked lightcurve |
|---|---|---|---|---|---|---|---|
| A | 74700 | 53598 | 0 | 0 | 0.00% | 0.00% |  |
| B | 74700 | 53602 | 0 | 0 | 0.00% | 0.00% |  |
| C | 74700 | 53607 | 0 | 0 | 0.00% | 0.00% |  |
| D | 74700 | 53451 | 0 | 0 | 0.00% | 0.00% |  |
Top three noisy pixels from each quadrant. If the there are fewer than three noisy pixels in the level2.evt file, extra rows are filled as -1
| Pixel properties | Quadrant properties | ||||||
|---|---|---|---|---|---|---|---|
| Quadrant | DetID | PixID | Counts | Sigma | Mean | Median | Sigma |
| A | 7 | 110 | 2406 | 9.19 | 748 | 701 | 185.5 |
| A | 9 | 19 | 2370 | 9.0 | 748 | 701 | 185.5 |
| A | 0 | 29 | 2328 | 8.77 | 748 | 701 | 185.5 |
| B | 2 | 9 | 2317 | 10.99 | 742 | 706 | 146.5 |
| B | 3 | 80 | 2103 | 9.53 | 742 | 706 | 146.5 |
| B | 3 | 17 | 1935 | 8.39 | 742 | 706 | 146.5 |
| C | 1 | 81 | 2417 | 8.7 | 764 | 714 | 195.7 |
| C | 1 | 80 | 2365 | 8.44 | 764 | 714 | 195.7 |
| C | 3 | 203 | 2225 | 7.72 | 764 | 714 | 195.7 |
| D | 7 | 3 | 1728 | 6.1 | 679 | 620 | 181.6 |
| D | 6 | 62 | 1717 | 6.04 | 679 | 620 | 181.6 |
| D | 6 | 38 | 1681 | 5.84 | 679 | 620 | 181.6 |
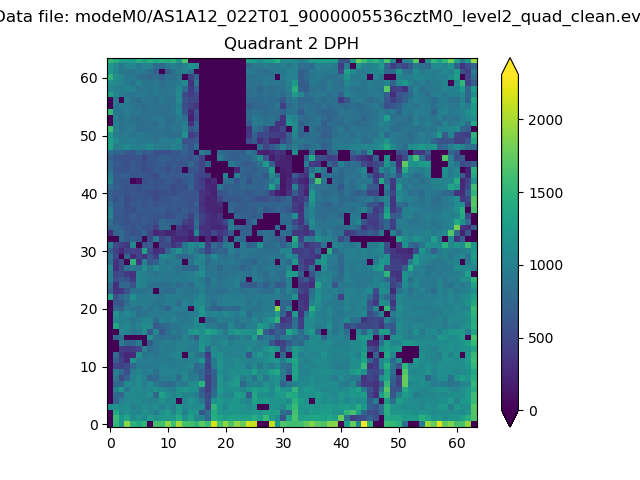
Histogram calculated using DETX and DETY for each event in the final _common_clean file
| Quadrant A |  |
 |
Quadrant B |
|---|---|---|---|
| Quadrant D | 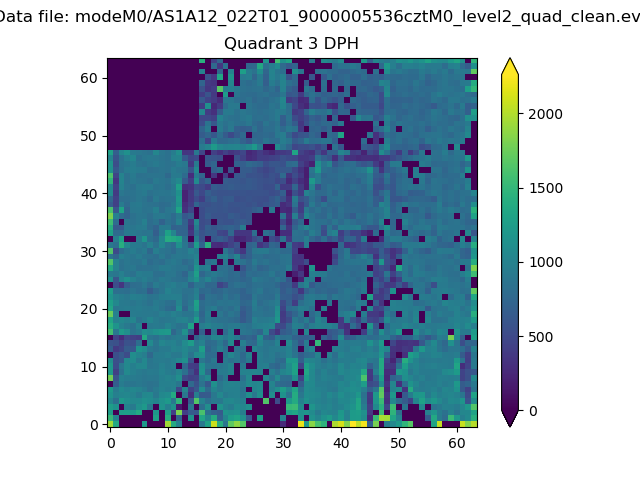 |
 |
Quadrant C |
| Plot type | Count rate plots | Images |
|---|---|---|
| Comparison with Poisson distribution Blue bars denote a histogram of data divided into 1 sec bins. Red curve is a Poisson curve with rate = median count rate of data. |
 |
 |
| Quadrant-wise count rates Data is divided into 100 sec bins |
 |
|
| Module-wise count rates for Quadrant A Data is divided into 100 sec bins |
 |
 |
| Module-wise count rates for Quadrant B Data is divided into 100 sec bins |
 |
 |
| Module-wise count rates for Quadrant C Data is divided into 100 sec bins |
 |
 |
| Module-wise count rates for Quadrant D Data is divided into 100 sec bins |
 |
 |
| Parameter | Plot |
|---|---|
| CZT HV Monitor |  |
| D_VDD |  |
| Temperature 1 |  |
| Veto HV Monitor |  |
| Veto LLD |  |
| Alpha Counter |  |
| _CPM_Rate |  |
| CZT Counter |  |
| +2.5 Volts monitor |  |
| +5 Volts monitor |  |
| _ROLL_ROT |  |
| _Roll_DEC |  |
| _Roll_RA |  |
| Veto Counter |  |