| Param | Original file | Final file |
|---|---|---|
| Filename | modeM0/AS1A12_056T02_9000005538cztM0_level2.fits | modeM0/AS1A12_056T02_9000005538cztM0_level2_quad_clean.evt |
| Size (bytes) | 5,491,952,640 | 6,328,609,920 |
| Size | 5.1 GB | 5.9 GB |
| Events in quadrant A | 33,379,826 | 40,103,673 |
| Events in quadrant B | 32,224,811 | 40,341,770 |
| Events in quadrant C | 32,888,151 | 38,055,761 |
| Events in quadrant D | 26,028,383 | 31,419,773 |
| Mode M0 | |||
|---|---|---|---|
| Quadrant | BADHDUFLAG | Total packets | Discarded packets |
| A | 0 | 1446105 | 0 |
| B | 0 | 1379484 | 0 |
| C | 0 | 1320294 | 0 |
| D | 0 | 1910238 | 0 |
| Mode M9 | |||
|---|---|---|---|
| Quadrant | BADHDUFLAG | Total packets | Discarded packets |
| A | 0 | 2298 | 0 |
| B | 0 | 2297 | 0 |
| C | 0 | 2295 | 0 |
| D | 0 | 2299 | 0 |
| Mode SS | |||
|---|---|---|---|
| Quadrant | BADHDUFLAG | Total packets | Discarded packets |
| A | 0 | 12481 | 0 |
| B | 0 | 12482 | 0 |
| C | 0 | 12475 | 0 |
| D | 0 | 12459 | 0 |
| Quadrant | Total seconds | Saturated seconds | Saturation percentage |
|---|---|---|---|
| A | 609907 | 9939 | 1.629593% |
| B | 610106 | 7349 | 1.204545% |
| C | 609962 | 4956 | 0.812510% |
| D | 609407 | 85070 | 13.959472% |
Noise dominated data is calculated using 1-second bins in cleaned event files. If a bin has >2000 counts, and if more than 50% of those come from <1% of pixels, then it is considered to be noise-dominated and hence unusable.
| Quadrant | # 1 sec bins | Bins with >0 counts | Bins with >2000 counts | High rate bins dominated by noise | Noise dominated (total time) | Noise dominated (detector-on time) | Marked lightcurve |
|---|---|---|---|---|---|---|---|
| A | 868891 | 611088 | 0 | 0 | 0.00% | 0.00% | 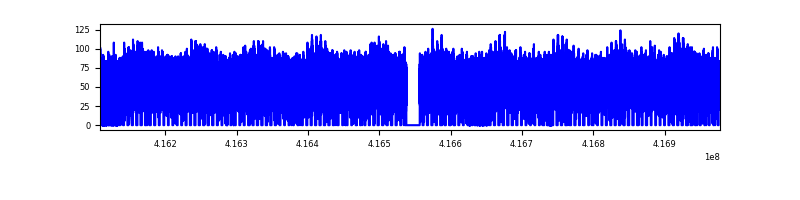 |
| B | 868891 | 610553 | 0 | 0 | 0.00% | 0.00% |  |
| C | 868891 | 611137 | 0 | 0 | 0.00% | 0.00% |  |
| D | 868891 | 606914 | 0 | 0 | 0.00% | 0.00% | 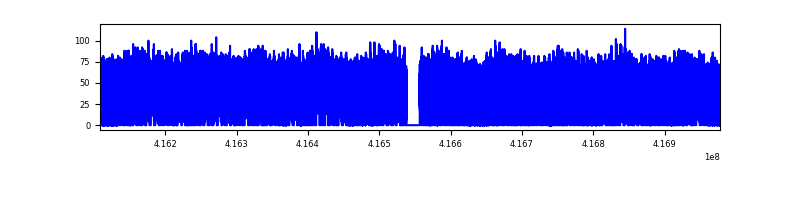 |
Top three noisy pixels from each quadrant. If the there are fewer than three noisy pixels in the level2.evt file, extra rows are filled as -1
| Pixel properties | Quadrant properties | ||||||
|---|---|---|---|---|---|---|---|
| Quadrant | DetID | PixID | Counts | Sigma | Mean | Median | Sigma |
| A | 7 | 110 | 27620 | 9.12 | 8735 | 8231 | 2127.1 |
| A | 9 | 19 | 27460 | 9.04 | 8735 | 8231 | 2127.1 |
| A | 0 | 29 | 27060 | 8.85 | 8735 | 8231 | 2127.1 |
| B | 2 | 9 | 27348 | 11.81 | 8532 | 8160 | 1625.1 |
| B | 3 | 80 | 23406 | 9.38 | 8532 | 8160 | 1625.1 |
| B | 3 | 17 | 22295 | 8.7 | 8532 | 8160 | 1625.1 |
| C | 1 | 81 | 27826 | 8.88 | 8691 | 8149 | 2216.3 |
| C | 1 | 80 | 26744 | 8.39 | 8691 | 8149 | 2216.3 |
| C | 3 | 202 | 25802 | 7.97 | 8691 | 8149 | 2216.3 |
| D | 7 | 3 | 19344 | 6.06 | 7445 | 6760 | 2078.2 |
| D | 10 | 189 | 19202 | 5.99 | 7445 | 6760 | 2078.2 |
| D | 6 | 38 | 18851 | 5.82 | 7445 | 6760 | 2078.2 |
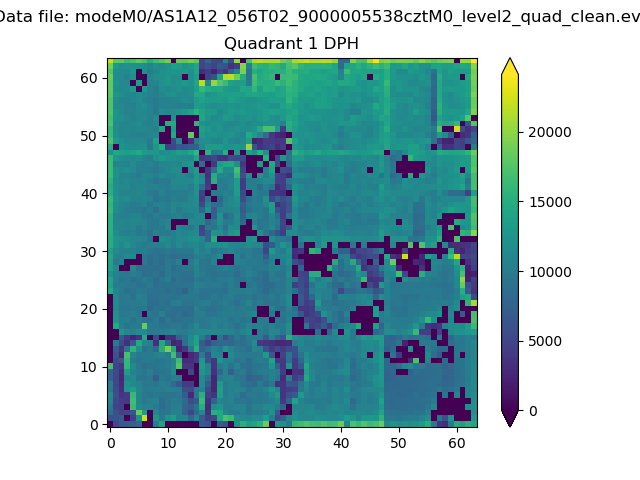
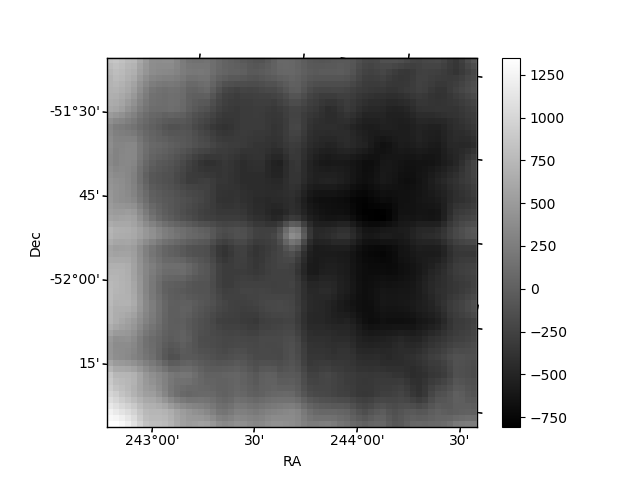
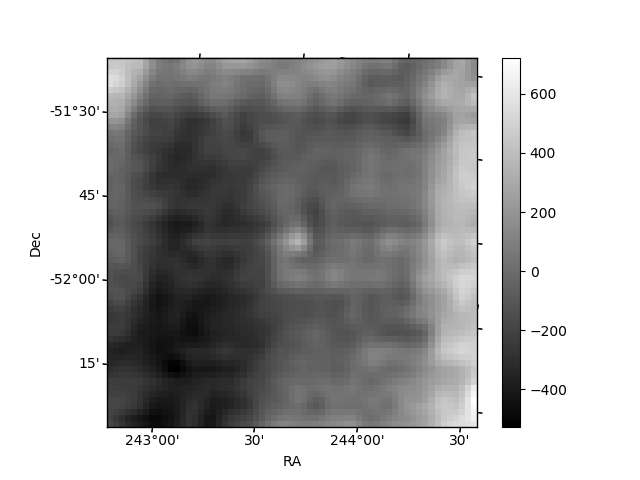
Histogram calculated using DETX and DETY for each event in the final _common_clean file
| Quadrant A |  |
 |
Quadrant B |
|---|---|---|---|
| Quadrant D |  |
 |
Quadrant C |
| Plot type | Count rate plots | Images |
|---|---|---|
| Comparison with Poisson distribution Blue bars denote a histogram of data divided into 1 sec bins. Red curve is a Poisson curve with rate = median count rate of data. |
 |
 |
| Quadrant-wise count rates Data is divided into 100 sec bins |
 |
|
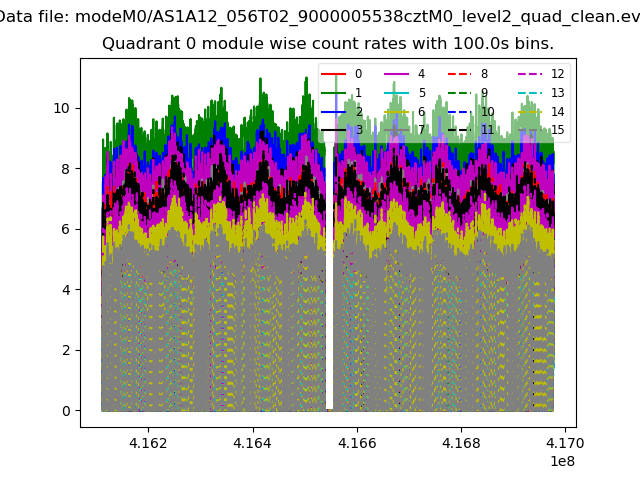
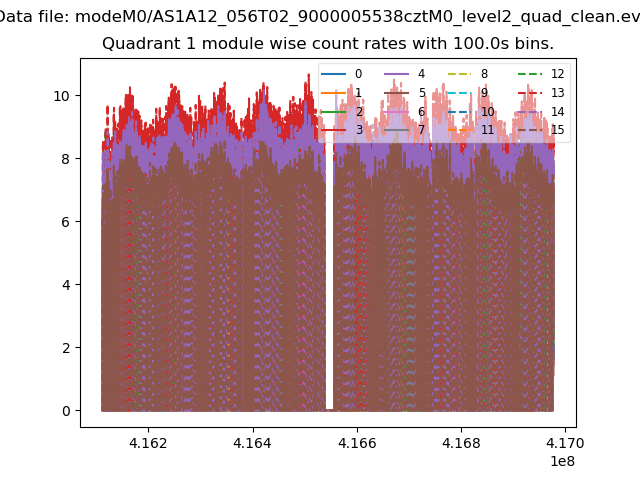
| Module-wise count rates for Quadrant A Data is divided into 100 sec bins |
 |
 |
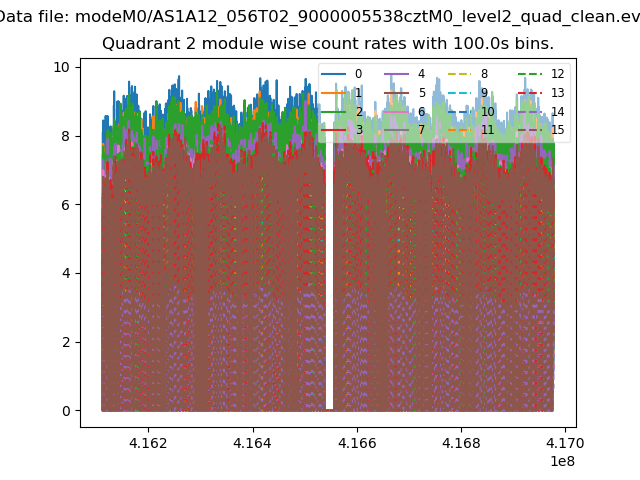
| Module-wise count rates for Quadrant B Data is divided into 100 sec bins |
 |
 |
| Module-wise count rates for Quadrant C Data is divided into 100 sec bins |
 |
 |
| Module-wise count rates for Quadrant D Data is divided into 100 sec bins |
 |
 |
| Parameter | Plot |
|---|---|
| CZT HV Monitor | 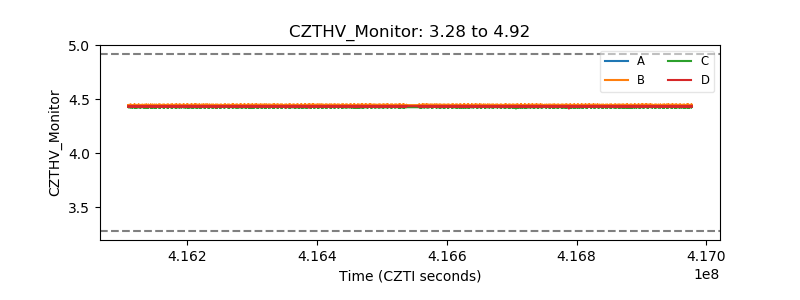 |
| D_VDD | 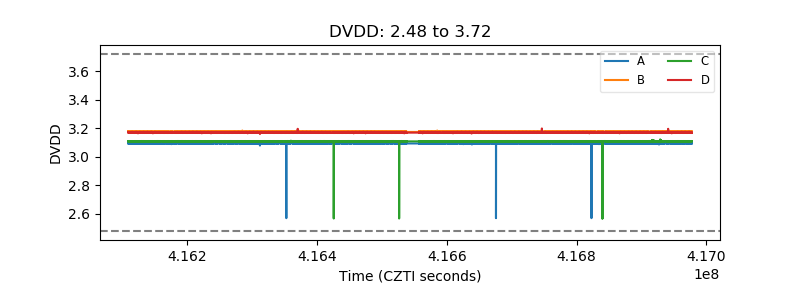 |
| Temperature 1 | 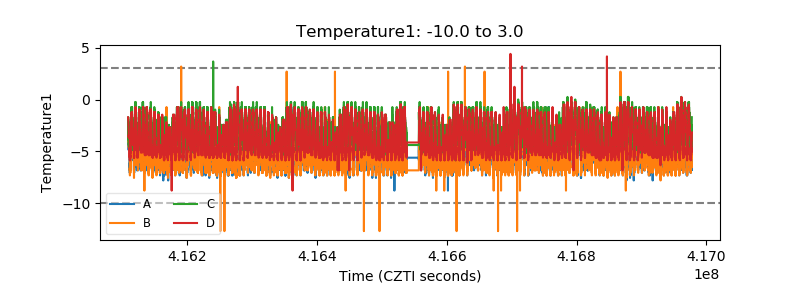 |
| Veto HV Monitor | 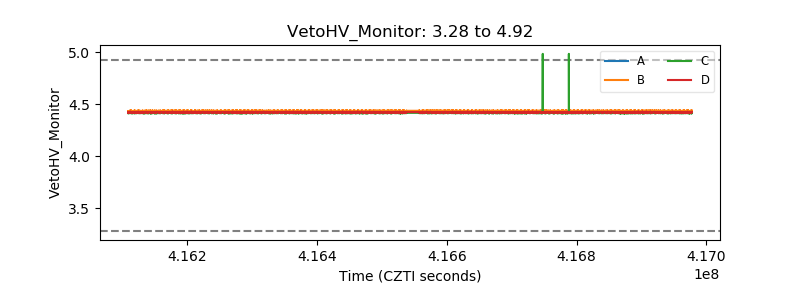 |
| Veto LLD |  |
| Alpha Counter |  |
| _CPM_Rate | 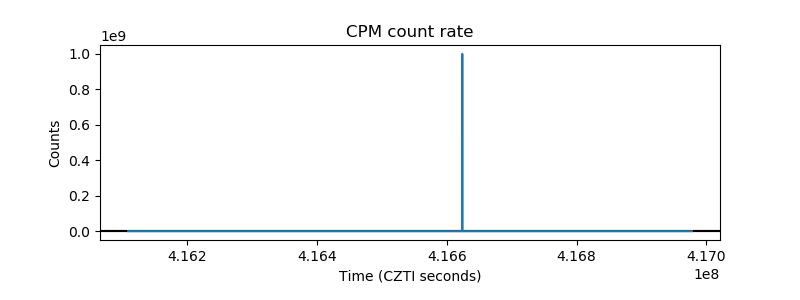 |
| CZT Counter | 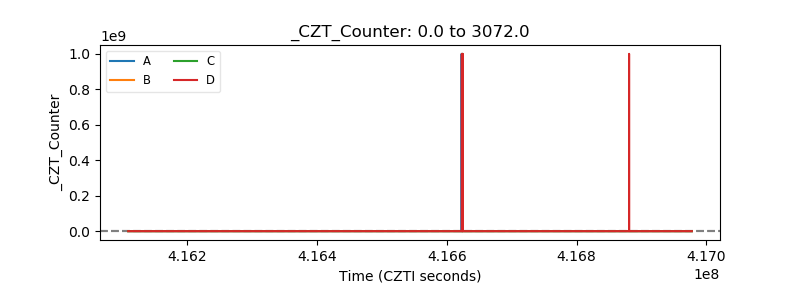 |
| +2.5 Volts monitor |  |
| +5 Volts monitor |  |
| _ROLL_ROT | 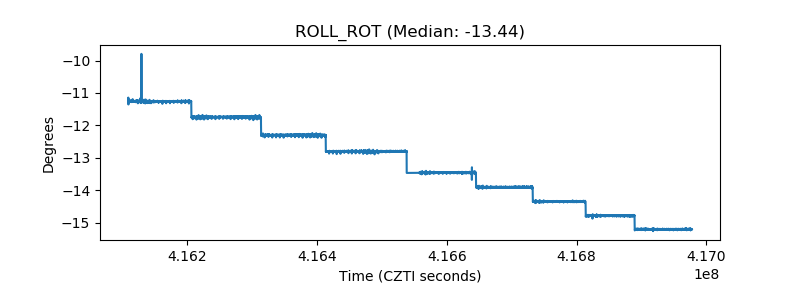 |
| _Roll_DEC |  |
| _Roll_RA | 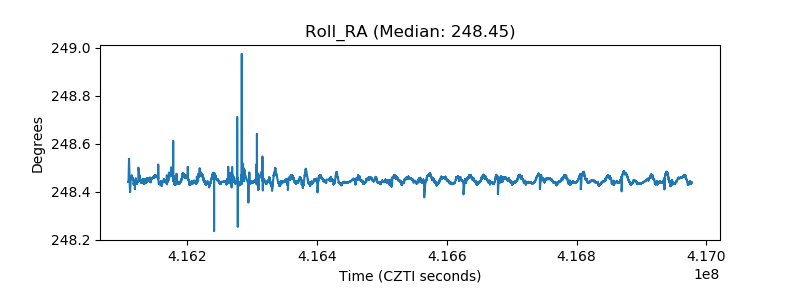 |
| Veto Counter |  |