| Param | Original file | Final file |
|---|---|---|
| Filename | modeM0/AS1A12_006T09_9000005546cztM0_level2.fits | modeM0/AS1A12_006T09_9000005546cztM0_level2_quad_clean.evt |
| Size (bytes) | 132,082,560 | 111,009,600 |
| Size | 126.0 MB | 105.9 MB |
| Events in quadrant A | 802,194 | 636,288 |
| Events in quadrant B | 760,862 | 631,454 |
| Events in quadrant C | 783,660 | 605,301 |
| Events in quadrant D | 583,288 | 419,066 |
| Mode M9 | |||
|---|---|---|---|
| Quadrant | BADHDUFLAG | Total packets | Discarded packets |
| A | 0 | 45 | 0 |
| B | 0 | 45 | 0 |
| C | 0 | 45 | 0 |
| D | 0 | 45 | 0 |
| Mode M0 | |||
|---|---|---|---|
| Quadrant | BADHDUFLAG | Total packets | Discarded packets |
| A | 0 | 34590 | 0 |
| B | 0 | 35606 | 0 |
| C | 0 | 32705 | 0 |
| D | 0 | 50575 | 0 |
| Mode SS | |||
|---|---|---|---|
| Quadrant | BADHDUFLAG | Total packets | Discarded packets |
| A | 0 | 316 | 0 |
| B | 0 | 316 | 0 |
| C | 0 | 316 | 0 |
| D | 0 | 316 | 0 |
| Quadrant | Total seconds | Saturated seconds | Saturation percentage |
|---|---|---|---|
| A | 15485 | 26 | 0.167904% |
| B | 15485 | 186 | 1.201162% |
| C | 15485 | 50 | 0.322893% |
| D | 15485 | 3634 | 23.467872% |
Noise dominated data is calculated using 1-second bins in cleaned event files. If a bin has >2000 counts, and if more than 50% of those come from <1% of pixels, then it is considered to be noise-dominated and hence unusable.
| Quadrant | # 1 sec bins | Bins with >0 counts | Bins with >2000 counts | High rate bins dominated by noise | Noise dominated (total time) | Noise dominated (detector-on time) | Marked lightcurve |
|---|---|---|---|---|---|---|---|
| A | 19572 | 15484 | 0 | 0 | 0.00% | 0.00% |  |
| B | 19572 | 15483 | 0 | 0 | 0.00% | 0.00% |  |
| C | 19572 | 15484 | 0 | 0 | 0.00% | 0.00% |  |
| D | 19572 | 15425 | 0 | 0 | 0.00% | 0.00% |  |
Top three noisy pixels from each quadrant. If the there are fewer than three noisy pixels in the level2.evt file, extra rows are filled as -1
| Pixel properties | Quadrant properties | ||||||
|---|---|---|---|---|---|---|---|
| Quadrant | DetID | PixID | Counts | Sigma | Mean | Median | Sigma |
| A | 9 | 19 | 709 | 9.28 | 209 | 196 | 55.3 |
| A | 7 | 110 | 679 | 8.73 | 209 | 196 | 55.3 |
| A | 0 | 29 | 667 | 8.52 | 209 | 196 | 55.3 |
| B | 2 | 9 | 700 | 11.95 | 201 | 191 | 42.5 |
| B | 3 | 80 | 562 | 8.71 | 201 | 191 | 42.5 |
| B | 2 | 8 | 540 | 8.19 | 201 | 191 | 42.5 |
| C | 1 | 81 | 671 | 8.52 | 207 | 193 | 56.1 |
| C | 1 | 80 | 632 | 7.82 | 207 | 193 | 56.1 |
| C | 3 | 203 | 624 | 7.68 | 207 | 193 | 56.1 |
| D | 7 | 5 | 444 | 5.7 | 169 | 154 | 50.8 |
| D | 1 | 3 | 441 | 5.64 | 169 | 154 | 50.8 |
| D | 7 | 3 | 433 | 5.49 | 169 | 154 | 50.8 |
Histogram calculated using DETX and DETY for each event in the final _common_clean file
| Quadrant A |  |
 |
Quadrant B |
|---|---|---|---|
| Quadrant D |  |
 |
Quadrant C |
| Plot type | Count rate plots | Images |
|---|---|---|
| Comparison with Poisson distribution Blue bars denote a histogram of data divided into 1 sec bins. Red curve is a Poisson curve with rate = median count rate of data. |
 |
 |
| Quadrant-wise count rates Data is divided into 100 sec bins |
 |
|
| Module-wise count rates for Quadrant A Data is divided into 100 sec bins |
 |
 |
| Module-wise count rates for Quadrant B Data is divided into 100 sec bins |
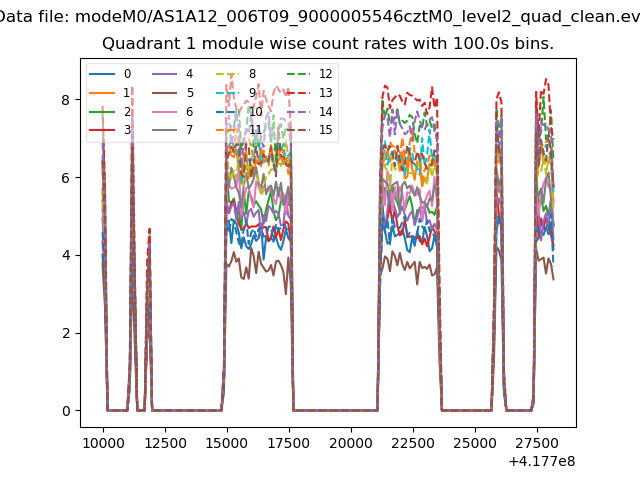 |
 |
| Module-wise count rates for Quadrant C Data is divided into 100 sec bins |
 |
 |
| Module-wise count rates for Quadrant D Data is divided into 100 sec bins |
 |
 |
| Parameter | Plot |
|---|---|
| CZT HV Monitor |  |
| D_VDD | 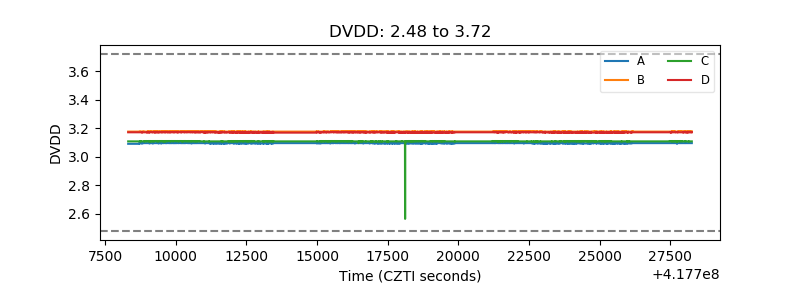 |
| Temperature 1 |  |
| Veto HV Monitor |  |
| Veto LLD | 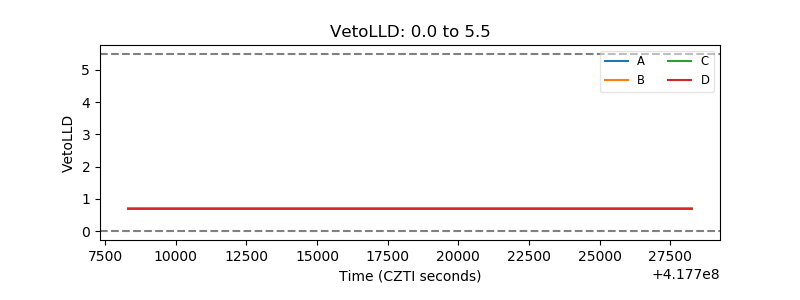 |
| Alpha Counter |  |
| _CPM_Rate |  |
| CZT Counter | 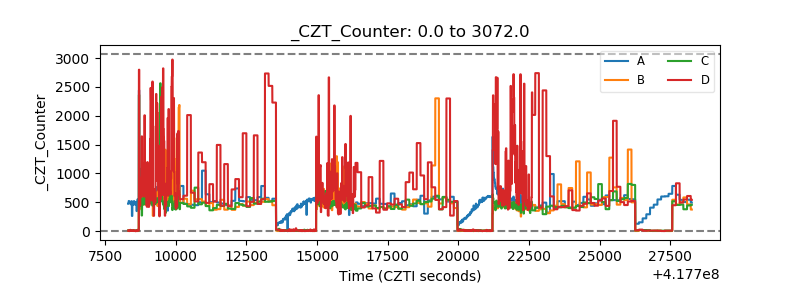 |
| +2.5 Volts monitor |  |
| +5 Volts monitor |  |
| _ROLL_ROT |  |
| _Roll_DEC |  |
| _Roll_RA | 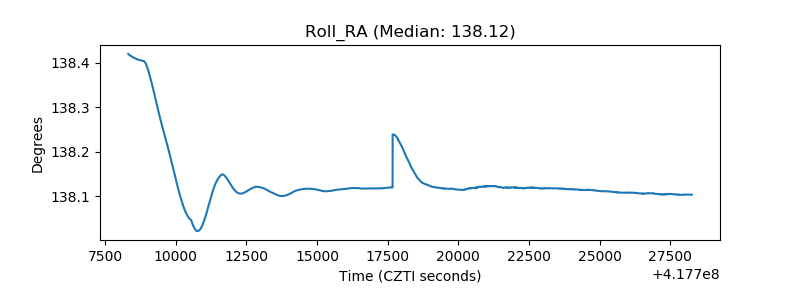 |
| Veto Counter |  |