| Param | Original file | Final file |
|---|---|---|
| Filename | modeM0/AS1A12_011T26_9000005548cztM0_level2.fits | modeM0/AS1A12_011T26_9000005548cztM0_level2_quad_clean.evt |
| Size (bytes) | 391,803,840 | 363,864,960 |
| Size | 373.7 MB | 347.0 MB |
| Events in quadrant A | 2,418,170 | 2,236,046 |
| Events in quadrant B | 2,310,730 | 2,237,117 |
| Events in quadrant C | 2,347,900 | 2,100,078 |
| Events in quadrant D | 1,739,106 | 1,400,007 |
| Mode M0 | |||
|---|---|---|---|
| Quadrant | BADHDUFLAG | Total packets | Discarded packets |
| A | 0 | 96354 | 0 |
| B | 0 | 94306 | 0 |
| C | 0 | 94861 | 0 |
| D | 0 | 137820 | 0 |
| Mode SS | |||
|---|---|---|---|
| Quadrant | BADHDUFLAG | Total packets | Discarded packets |
| A | 0 | 906 | 0 |
| B | 0 | 906 | 0 |
| C | 0 | 906 | 0 |
| D | 0 | 906 | 0 |
| Mode M9 | |||
|---|---|---|---|
| Quadrant | BADHDUFLAG | Total packets | Discarded packets |
| A | 0 | 183 | 0 |
| B | 0 | 183 | 0 |
| C | 0 | 183 | 0 |
| D | 0 | 183 | 0 |
| Quadrant | Total seconds | Saturated seconds | Saturation percentage |
|---|---|---|---|
| A | 44368 | 87 | 0.196087% |
| B | 44352 | 460 | 1.037157% |
| C | 44358 | 248 | 0.559087% |
| D | 44369 | 10705 | 24.127206% |
Noise dominated data is calculated using 1-second bins in cleaned event files. If a bin has >2000 counts, and if more than 50% of those come from <1% of pixels, then it is considered to be noise-dominated and hence unusable.
| Quadrant | # 1 sec bins | Bins with >0 counts | Bins with >2000 counts | High rate bins dominated by noise | Noise dominated (total time) | Noise dominated (detector-on time) | Marked lightcurve |
|---|---|---|---|---|---|---|---|
| A | 62613 | 44382 | 0 | 0 | 0.00% | 0.00% | 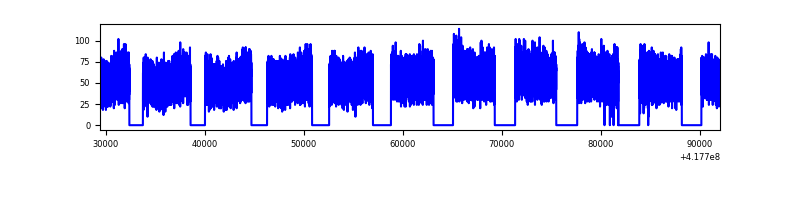 |
| B | 62613 | 44374 | 0 | 0 | 0.00% | 0.00% | 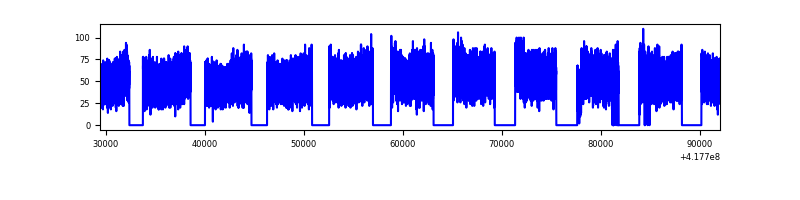 |
| C | 62613 | 44376 | 0 | 0 | 0.00% | 0.00% | 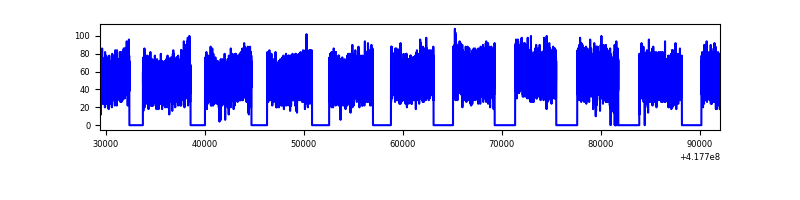 |
| D | 62613 | 44210 | 0 | 0 | 0.00% | 0.00% | 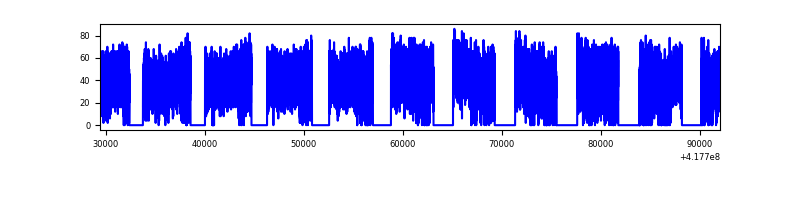 |
Top three noisy pixels from each quadrant. If the there are fewer than three noisy pixels in the level2.evt file, extra rows are filled as -1
| Pixel properties | Quadrant properties | ||||||
|---|---|---|---|---|---|---|---|
| Quadrant | DetID | PixID | Counts | Sigma | Mean | Median | Sigma |
| A | 7 | 110 | 2015 | 9.13 | 630 | 592 | 155.9 |
| A | 0 | 29 | 1941 | 8.65 | 630 | 592 | 155.9 |
| A | 9 | 19 | 1904 | 8.42 | 630 | 592 | 155.9 |
| B | 2 | 9 | 1995 | 11.9 | 610 | 583 | 118.7 |
| B | 3 | 80 | 1683 | 9.27 | 610 | 583 | 118.7 |
| B | 2 | 8 | 1654 | 9.02 | 610 | 583 | 118.7 |
| C | 3 | 202 | 1874 | 8.05 | 620 | 580 | 160.7 |
| C | 1 | 81 | 1859 | 7.96 | 620 | 580 | 160.7 |
| C | 3 | 203 | 1855 | 7.93 | 620 | 580 | 160.7 |
| D | 7 | 3 | 1378 | 6.25 | 505 | 460 | 146.9 |
| D | 6 | 67 | 1352 | 6.07 | 505 | 460 | 146.9 |
| D | 6 | 38 | 1294 | 5.67 | 505 | 460 | 146.9 |
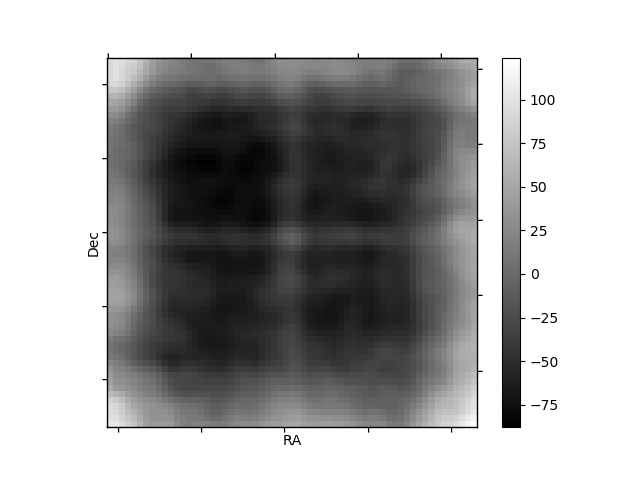
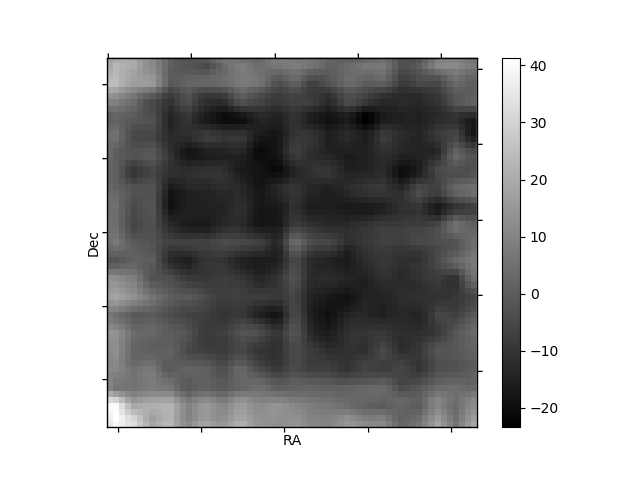
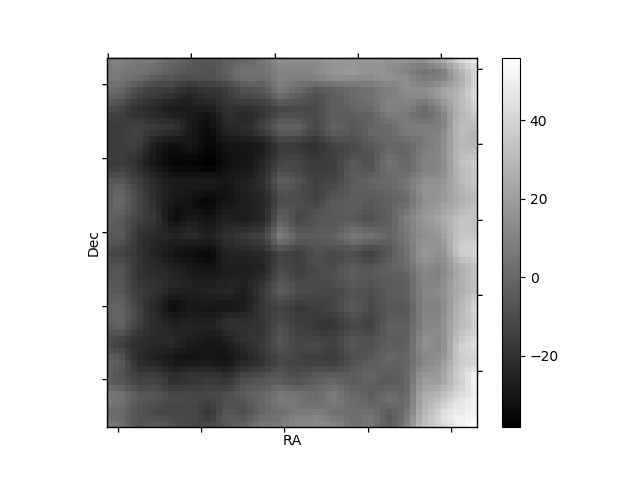
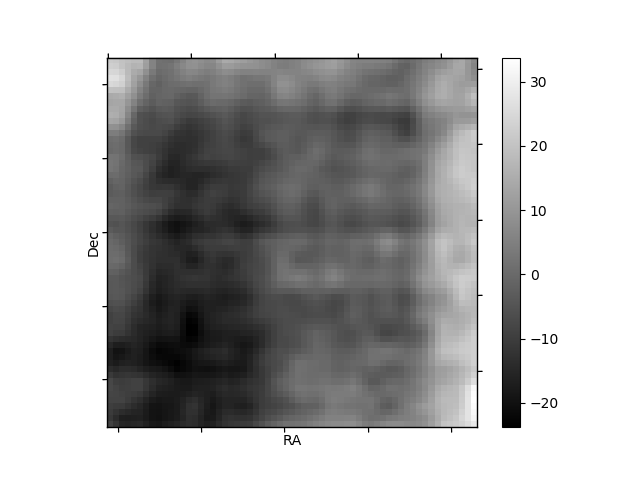
Histogram calculated using DETX and DETY for each event in the final _common_clean file
| Quadrant A | 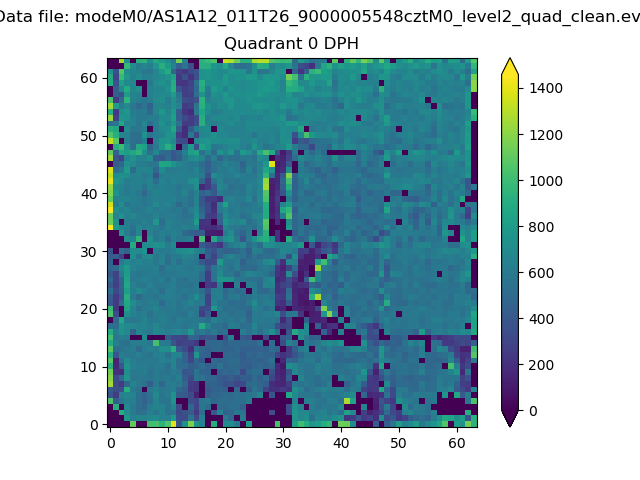 |
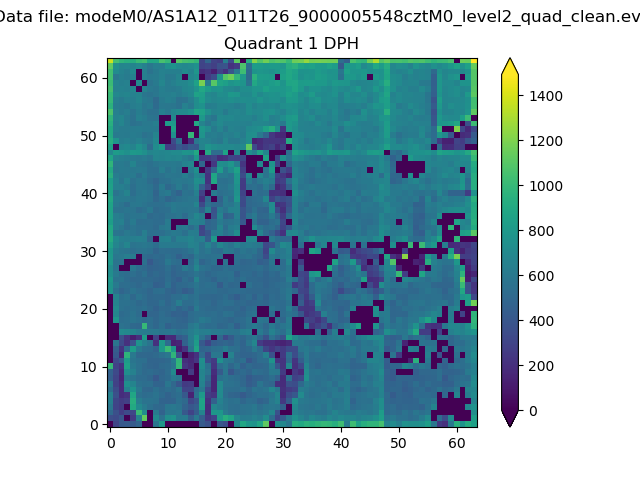 |
Quadrant B |
|---|---|---|---|
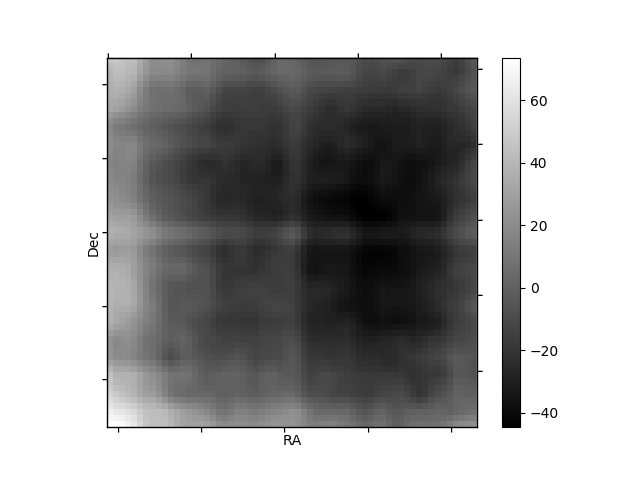
| Quadrant D | 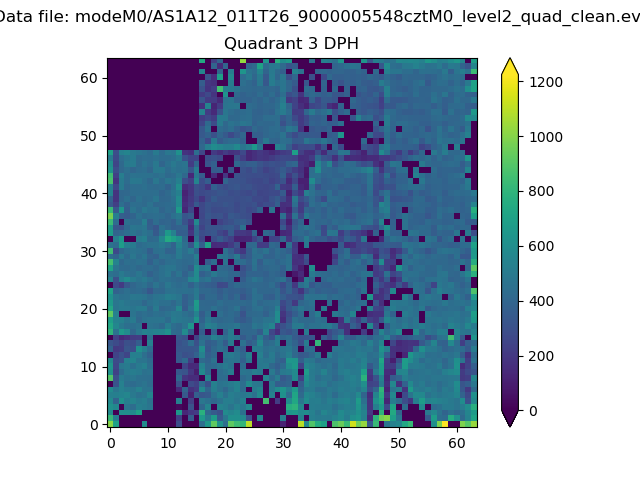 |
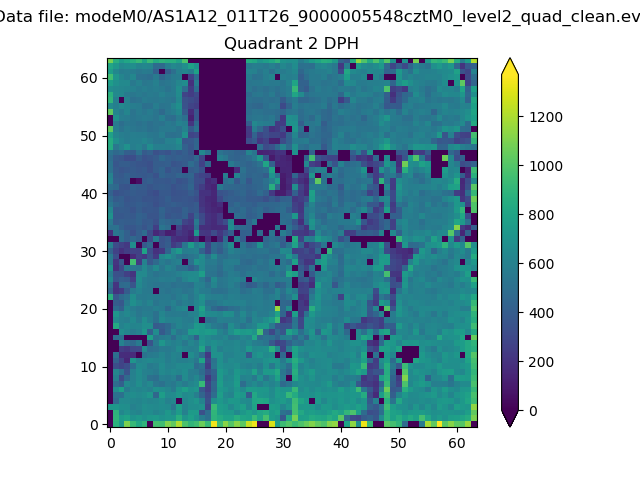 |
Quadrant C |
| Plot type | Count rate plots | Images |
|---|---|---|
| Comparison with Poisson distribution Blue bars denote a histogram of data divided into 1 sec bins. Red curve is a Poisson curve with rate = median count rate of data. |
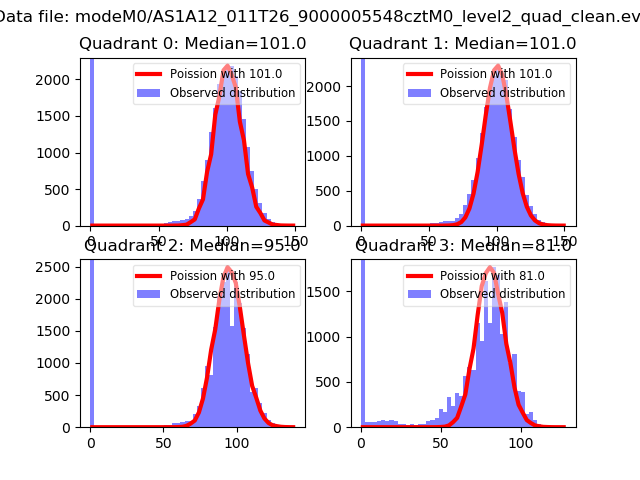 |
 |
| Quadrant-wise count rates Data is divided into 100 sec bins |
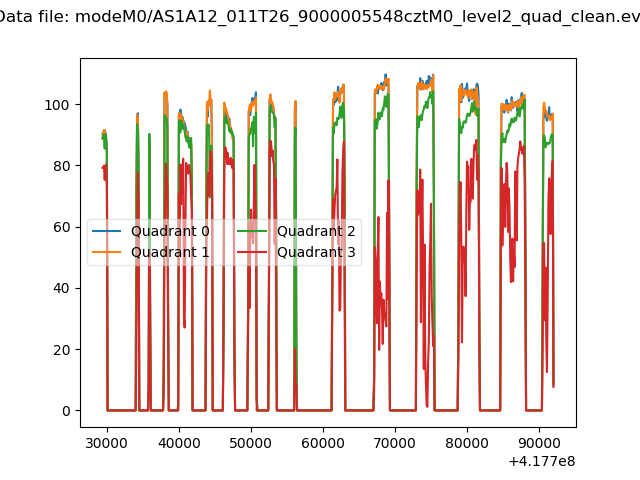 |
|
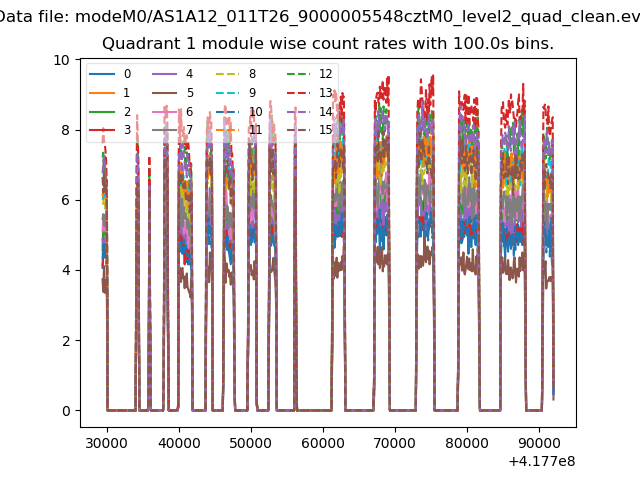
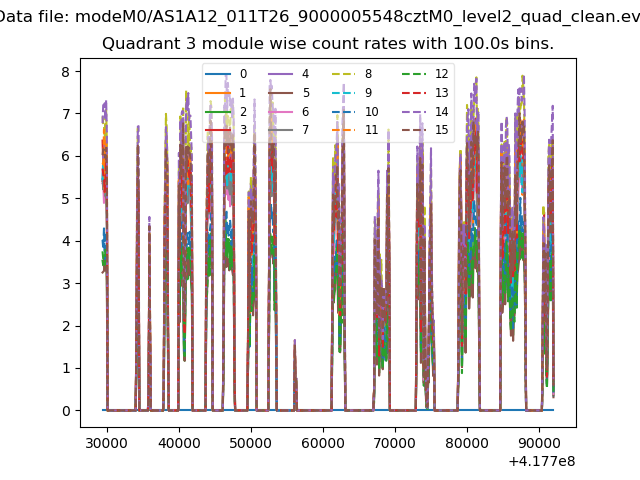
| Module-wise count rates for Quadrant A Data is divided into 100 sec bins |
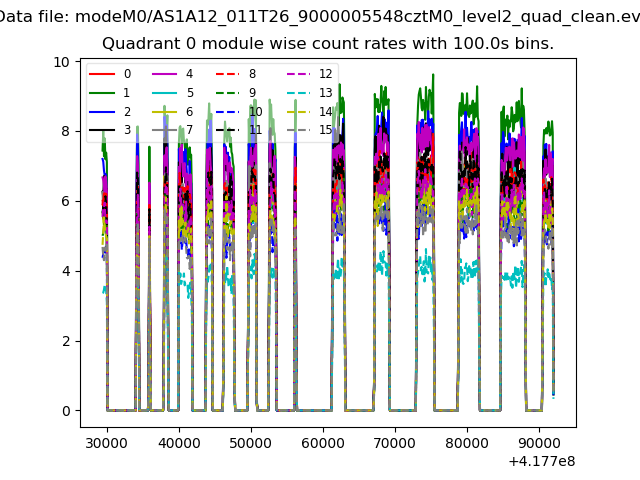 |
 |
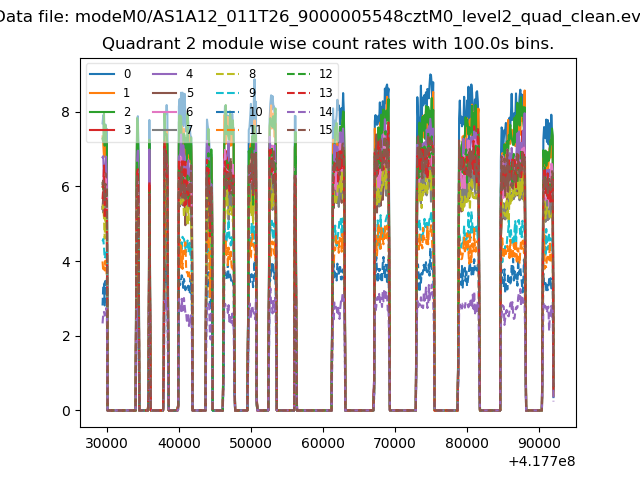
| Module-wise count rates for Quadrant B Data is divided into 100 sec bins |
 |
 |
| Module-wise count rates for Quadrant C Data is divided into 100 sec bins |
 |
 |
| Module-wise count rates for Quadrant D Data is divided into 100 sec bins |
 |
 |
| Parameter | Plot |
|---|---|
| CZT HV Monitor | 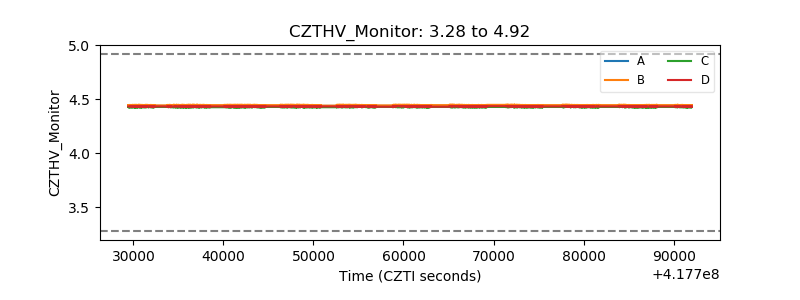 |
| D_VDD | 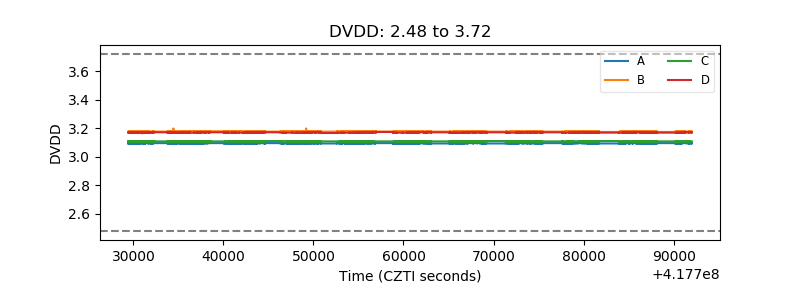 |
| Temperature 1 | 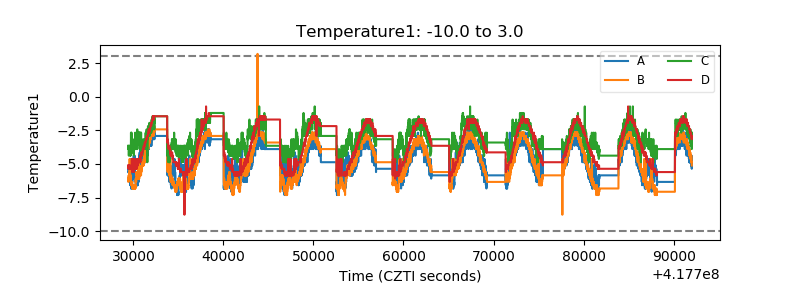 |
| Veto HV Monitor | 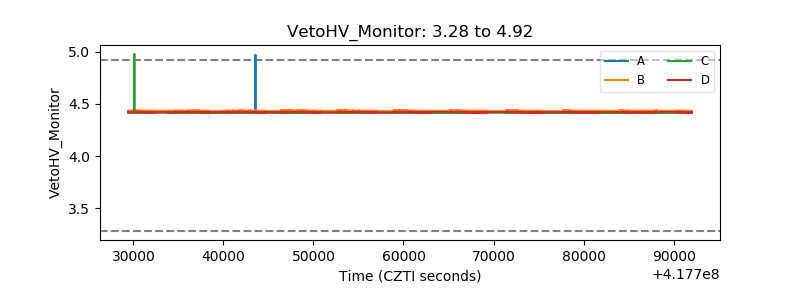 |
| Veto LLD | 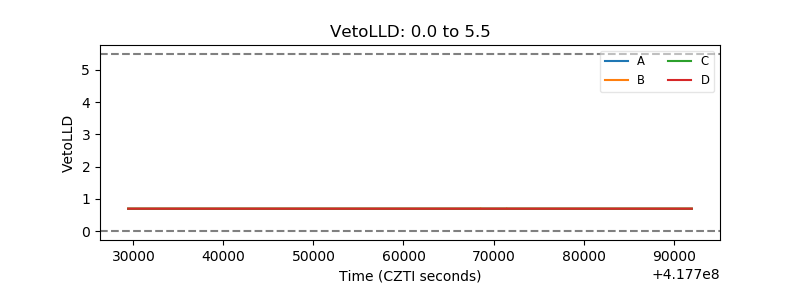 |
| Alpha Counter | 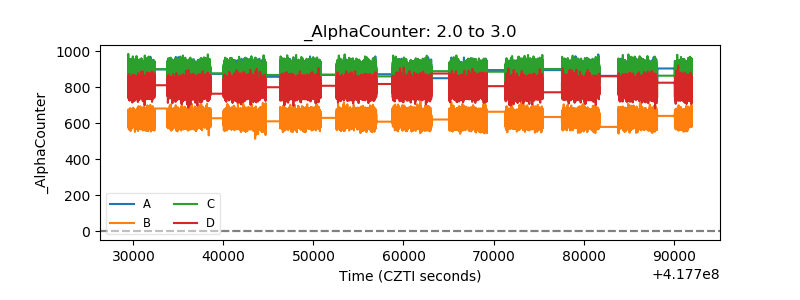 |
| _CPM_Rate | 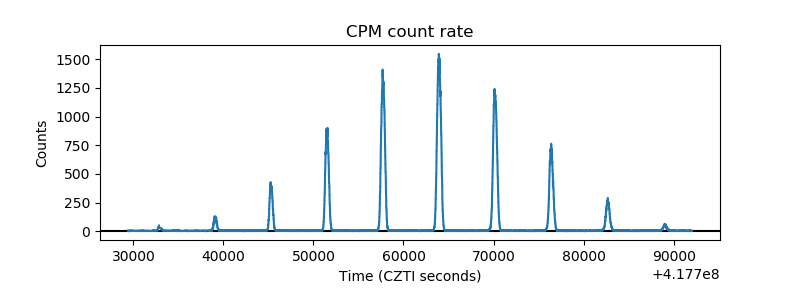 |
| CZT Counter | 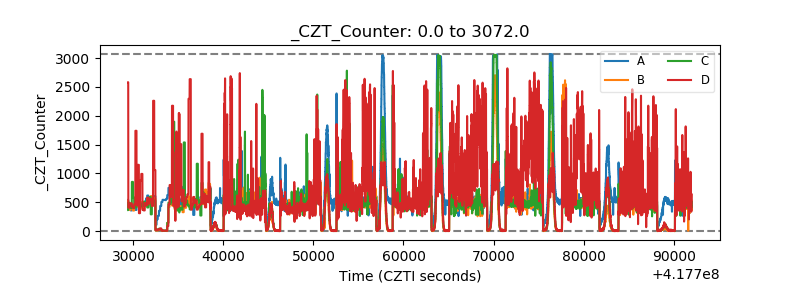 |
| +2.5 Volts monitor | 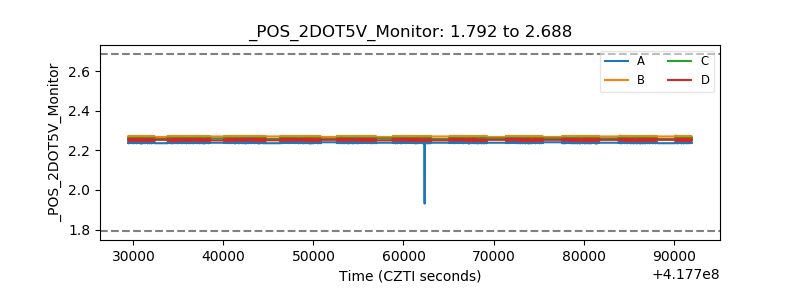 |
| +5 Volts monitor | 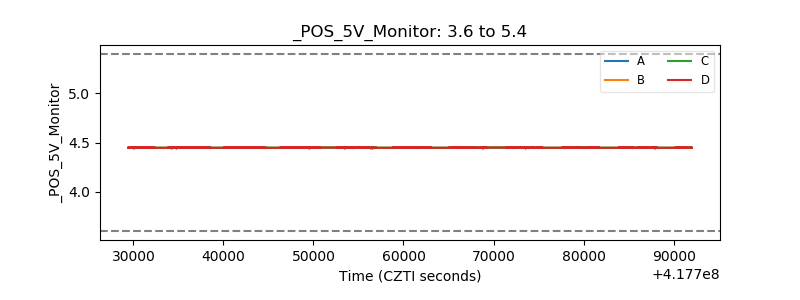 |
| _ROLL_ROT | 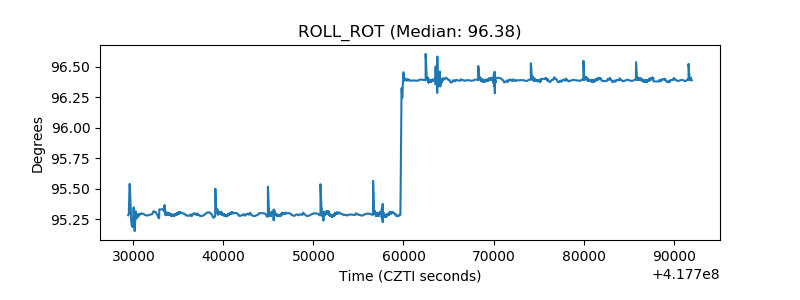 |
| _Roll_DEC | 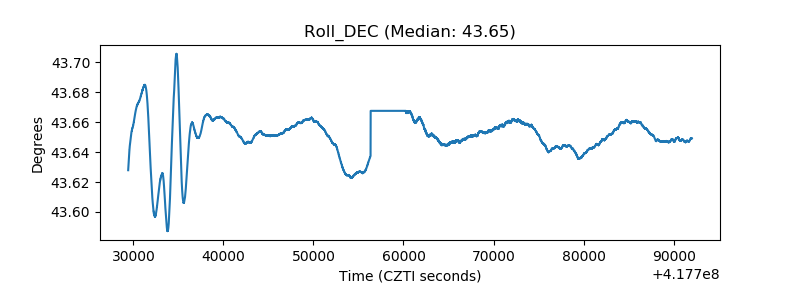 |
| _Roll_RA | 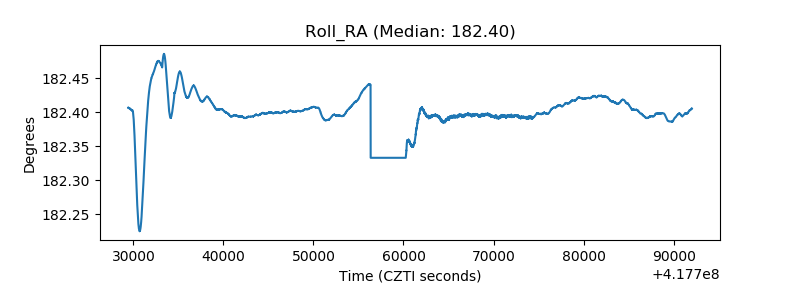 |
| Veto Counter | 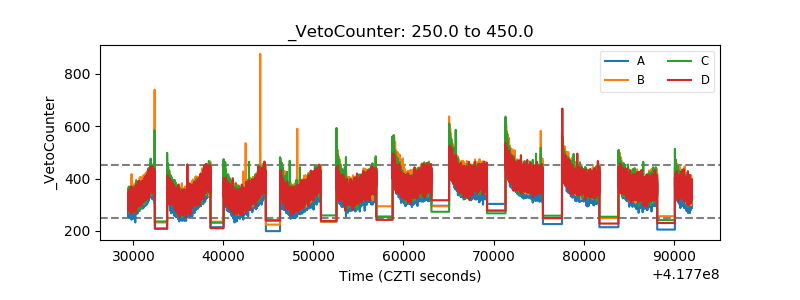 |