| Param | Original file | Final file |
|---|---|---|
| Filename | modeM0/AS1A12_054T02_9000005550cztM0_level2.fits | modeM0/AS1A12_054T02_9000005550cztM0_level2_quad_clean.evt |
| Size (bytes) | 2,346,013,440 | 2,689,467,840 |
| Size | 2.2 GB | 2.5 GB |
| Events in quadrant A | 14,469,234 | 17,868,937 |
| Events in quadrant B | 13,604,318 | 17,216,781 |
| Events in quadrant C | 14,019,594 | 16,688,236 |
| Events in quadrant D | 10,209,790 | 10,968,674 |
| Mode SS | |||
|---|---|---|---|
| Quadrant | BADHDUFLAG | Total packets | Discarded packets |
| A | 0 | 5574 | 0 |
| B | 0 | 5576 | 0 |
| C | 0 | 5576 | 0 |
| D | 0 | 5576 | 0 |
| Mode M0 | |||
|---|---|---|---|
| Quadrant | BADHDUFLAG | Total packets | Discarded packets |
| A | 0 | 589399 | 0 |
| B | 0 | 705546 | 0 |
| C | 0 | 585163 | 0 |
| D | 0 | 757203 | 0 |
| Mode M9 | |||
|---|---|---|---|
| Quadrant | BADHDUFLAG | Total packets | Discarded packets |
| A | 0 | 1012 | 0 |
| B | 0 | 1012 | 0 |
| C | 0 | 1012 | 0 |
| D | 0 | 1012 | 0 |
| Quadrant | Total seconds | Saturated seconds | Saturation percentage |
|---|---|---|---|
| A | 273136 | 551 | 0.201731% |
| B | 273130 | 8333 | 3.050928% |
| C | 273130 | 2813 | 1.029912% |
| D | 273134 | 73241 | 26.815043% |
Noise dominated data is calculated using 1-second bins in cleaned event files. If a bin has >2000 counts, and if more than 50% of those come from <1% of pixels, then it is considered to be noise-dominated and hence unusable.
| Quadrant | # 1 sec bins | Bins with >0 counts | Bins with >2000 counts | High rate bins dominated by noise | Noise dominated (total time) | Noise dominated (detector-on time) | Marked lightcurve |
|---|---|---|---|---|---|---|---|
| A | 374686 | 273139 | 0 | 0 | 0.00% | 0.00% |  |
| B | 374686 | 273104 | 0 | 0 | 0.00% | 0.00% |  |
| C | 374686 | 272985 | 0 | 0 | 0.00% | 0.00% |  |
| D | 374686 | 270134 | 0 | 0 | 0.00% | 0.00% | 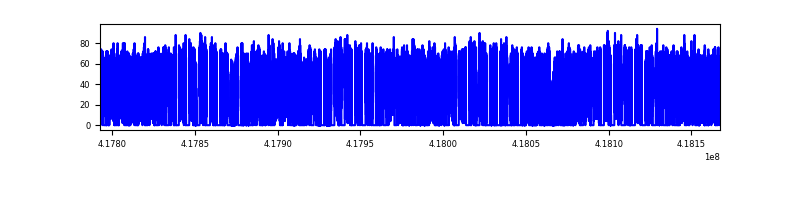 |
Top three noisy pixels from each quadrant. If the there are fewer than three noisy pixels in the level2.evt file, extra rows are filled as -1
| Pixel properties | Quadrant properties | ||||||
|---|---|---|---|---|---|---|---|
| Quadrant | DetID | PixID | Counts | Sigma | Mean | Median | Sigma |
| A | 9 | 19 | 11932 | 8.97 | 3778 | 3543 | 934.8 |
| A | 7 | 110 | 11859 | 8.9 | 3778 | 3543 | 934.8 |
| A | 0 | 29 | 11764 | 8.79 | 3778 | 3543 | 934.8 |
| B | 2 | 9 | 11319 | 11.4 | 3603 | 3442 | 690.7 |
| B | 3 | 80 | 9825 | 9.24 | 3603 | 3442 | 690.7 |
| B | 3 | 17 | 9405 | 8.63 | 3603 | 3442 | 690.7 |
| C | 1 | 81 | 11494 | 8.5 | 3704 | 3462 | 945.4 |
| C | 1 | 80 | 11143 | 8.12 | 3704 | 3462 | 945.4 |
| C | 3 | 203 | 10943 | 7.91 | 3704 | 3462 | 945.4 |
| D | 4 | 160 | 7825 | 5.93 | 2966 | 2684 | 867.5 |
| D | 7 | 3 | 7812 | 5.91 | 2966 | 2684 | 867.5 |
| D | 10 | 189 | 7802 | 5.9 | 2966 | 2684 | 867.5 |
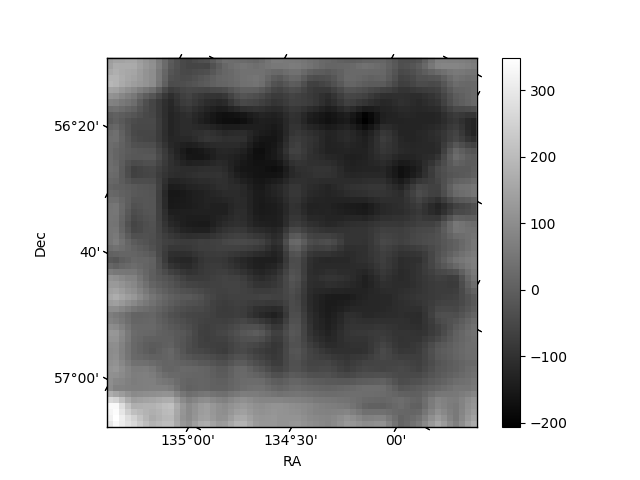
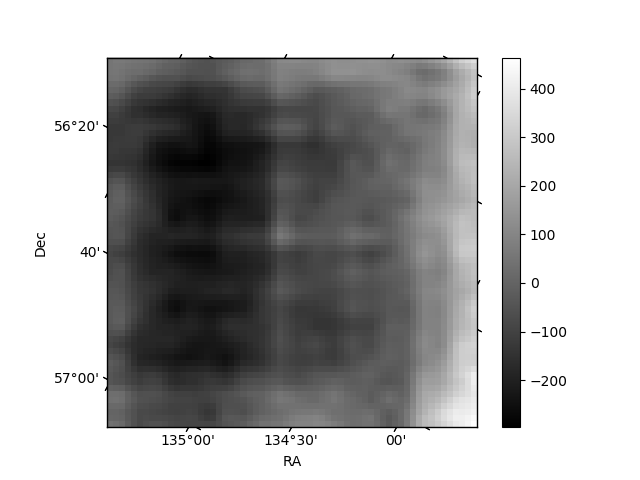
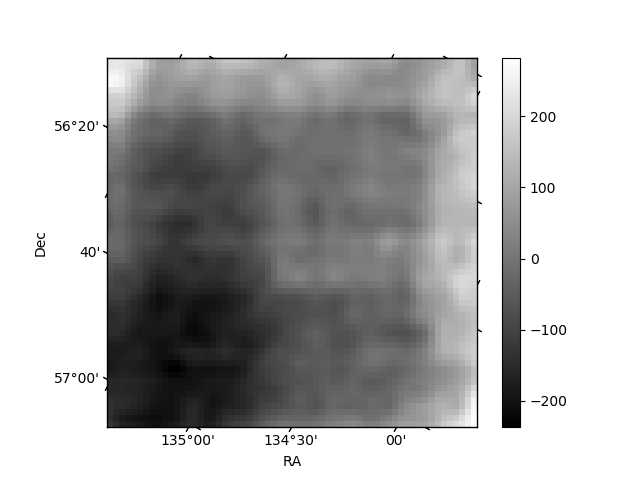
Histogram calculated using DETX and DETY for each event in the final _common_clean file
| Quadrant A | 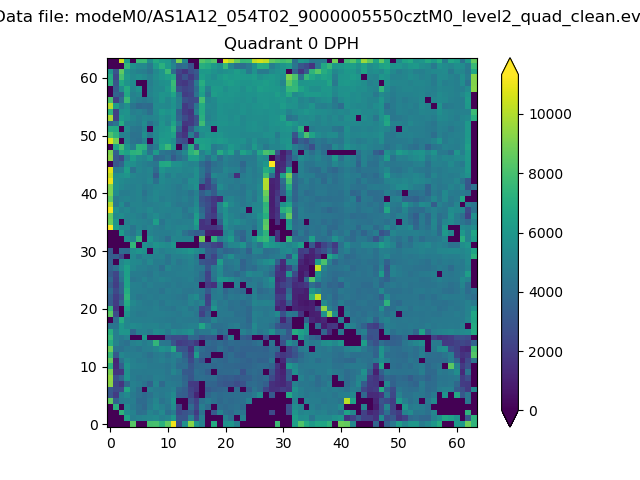 |
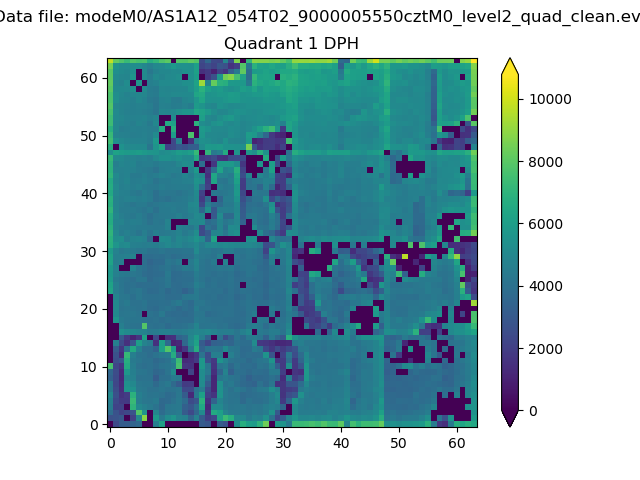 |
Quadrant B |
|---|---|---|---|
| Quadrant D |  |
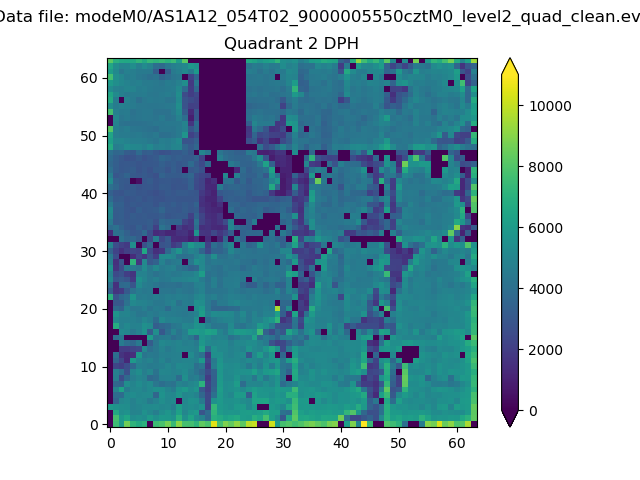 |
Quadrant C |
| Plot type | Count rate plots | Images |
|---|---|---|
| Comparison with Poisson distribution Blue bars denote a histogram of data divided into 1 sec bins. Red curve is a Poisson curve with rate = median count rate of data. |
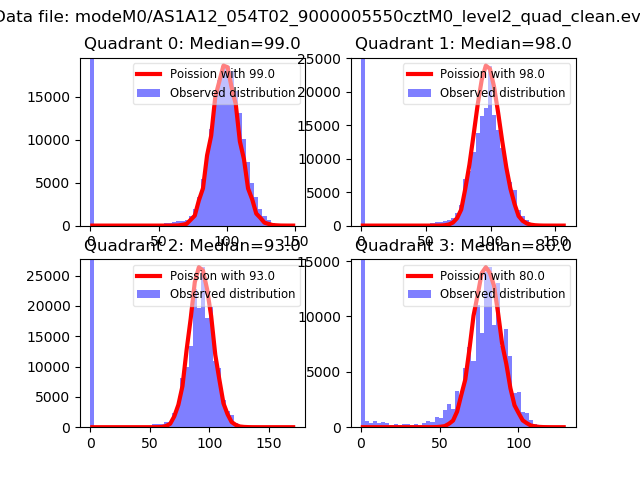 |
 |
| Quadrant-wise count rates Data is divided into 100 sec bins |
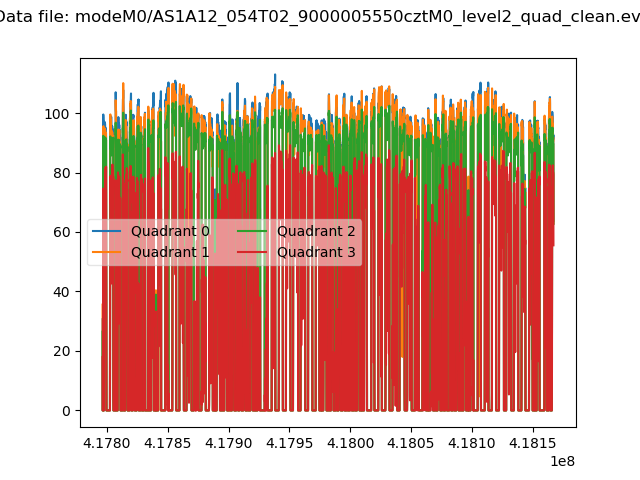 |
|
| Module-wise count rates for Quadrant A Data is divided into 100 sec bins |
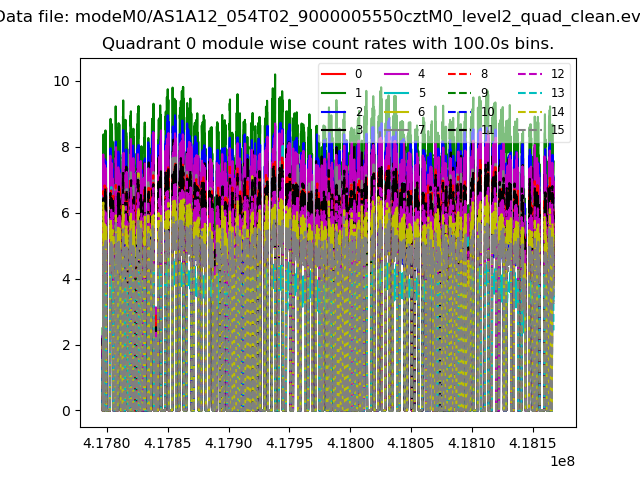 |
 |
| Module-wise count rates for Quadrant B Data is divided into 100 sec bins |
 |
 |
| Module-wise count rates for Quadrant C Data is divided into 100 sec bins |
 |
 |
| Module-wise count rates for Quadrant D Data is divided into 100 sec bins |
 |
 |
| Parameter | Plot |
|---|---|
| CZT HV Monitor |  |
| D_VDD |  |
| Temperature 1 |  |
| Veto HV Monitor |  |
| Veto LLD | 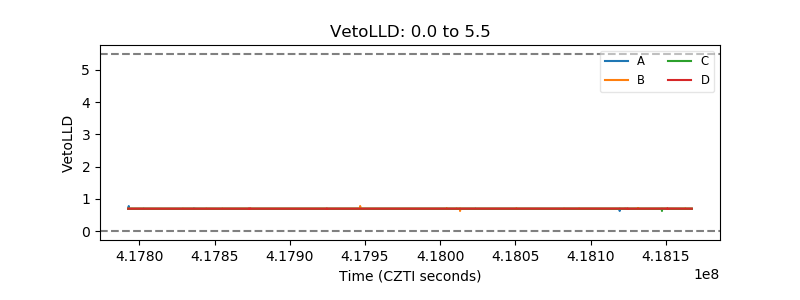 |
| Alpha Counter |  |
| _CPM_Rate |  |
| CZT Counter |  |
| +2.5 Volts monitor |  |
| +5 Volts monitor |  |
| _ROLL_ROT |  |
| _Roll_DEC | 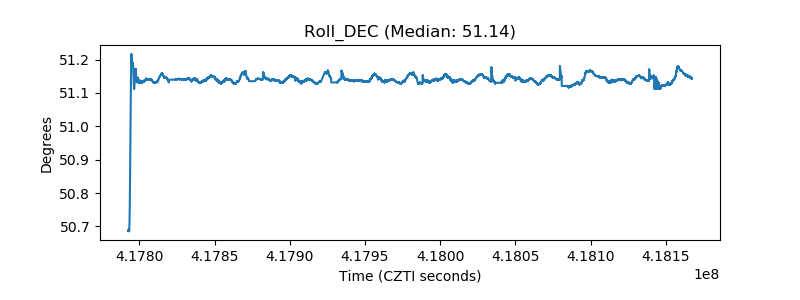 |
| _Roll_RA |  |
| Veto Counter |  |