| Param | Original file | Final file |
|---|---|---|
| Filename | modeM0/AS1A12_011T59_9000005552cztM0_level2.fits | modeM0/AS1A12_011T59_9000005552cztM0_level2_quad_clean.evt |
| Size (bytes) | 357,946,560 | 386,470,080 |
| Size | 341.4 MB | 368.6 MB |
| Events in quadrant A | 2,183,472 | 2,401,289 |
| Events in quadrant B | 2,099,766 | 2,411,105 |
| Events in quadrant C | 2,149,340 | 2,332,500 |
| Events in quadrant D | 1,592,936 | 1,747,623 |
| Mode M0 | |||
|---|---|---|---|
| Quadrant | BADHDUFLAG | Total packets | Discarded packets |
| A | 0 | 87354 | 0 |
| B | 0 | 93593 | 0 |
| C | 0 | 84290 | 0 |
| D | 0 | 103672 | 0 |
| Mode M9 | |||
|---|---|---|---|
| Quadrant | BADHDUFLAG | Total packets | Discarded packets |
| A | 0 | 170 | 0 |
| B | 0 | 170 | 0 |
| C | 0 | 170 | 0 |
| D | 0 | 170 | 0 |
| Mode SS | |||
|---|---|---|---|
| Quadrant | BADHDUFLAG | Total packets | Discarded packets |
| A | 0 | 834 | 0 |
| B | 0 | 834 | 0 |
| C | 0 | 834 | 0 |
| D | 0 | 834 | 0 |
| Quadrant | Total seconds | Saturated seconds | Saturation percentage |
|---|---|---|---|
| A | 40944 | 93 | 0.227140% |
| B | 40944 | 393 | 0.959848% |
| C | 40944 | 75 | 0.183177% |
| D | 40944 | 8938 | 21.829816% |
Noise dominated data is calculated using 1-second bins in cleaned event files. If a bin has >2000 counts, and if more than 50% of those come from <1% of pixels, then it is considered to be noise-dominated and hence unusable.
| Quadrant | # 1 sec bins | Bins with >0 counts | Bins with >2000 counts | High rate bins dominated by noise | Noise dominated (total time) | Noise dominated (detector-on time) | Marked lightcurve |
|---|---|---|---|---|---|---|---|
| A | 57857 | 40942 | 0 | 0 | 0.00% | 0.00% |  |
| B | 57858 | 40943 | 0 | 0 | 0.00% | 0.00% |  |
| C | 57858 | 40944 | 0 | 0 | 0.00% | 0.00% |  |
| D | 57858 | 40554 | 0 | 0 | 0.00% | 0.00% |  |
Top three noisy pixels from each quadrant. If the there are fewer than three noisy pixels in the level2.evt file, extra rows are filled as -1
| Pixel properties | Quadrant properties | ||||||
|---|---|---|---|---|---|---|---|
| Quadrant | DetID | PixID | Counts | Sigma | Mean | Median | Sigma |
| A | 7 | 110 | 1804 | 8.8 | 571 | 537 | 144.0 |
| A | 0 | 29 | 1762 | 8.51 | 571 | 537 | 144.0 |
| A | 9 | 19 | 1668 | 7.86 | 571 | 537 | 144.0 |
| B | 2 | 9 | 1753 | 11.37 | 555 | 531 | 107.5 |
| B | 3 | 80 | 1536 | 9.35 | 555 | 531 | 107.5 |
| B | 5 | 128 | 1475 | 8.78 | 555 | 531 | 107.5 |
| C | 3 | 203 | 1765 | 8.35 | 568 | 532 | 147.8 |
| C | 1 | 81 | 1765 | 8.35 | 568 | 532 | 147.8 |
| C | 1 | 80 | 1702 | 7.92 | 568 | 532 | 147.8 |
| D | 7 | 3 | 1256 | 6.19 | 462 | 421 | 134.9 |
| D | 4 | 160 | 1223 | 5.95 | 462 | 421 | 134.9 |
| D | 10 | 189 | 1205 | 5.81 | 462 | 421 | 134.9 |
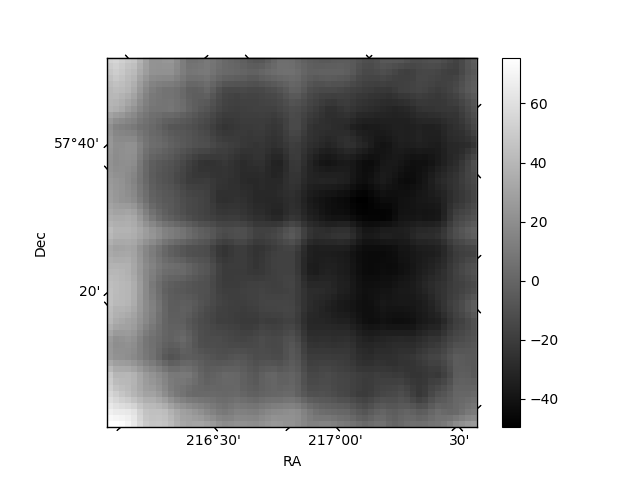
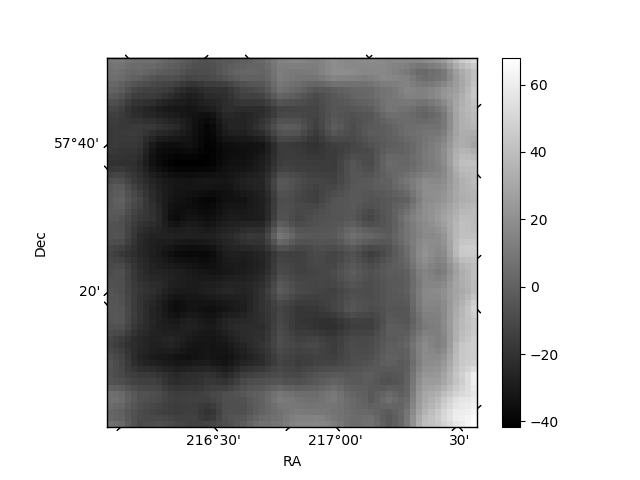
Histogram calculated using DETX and DETY for each event in the final _common_clean file
| Quadrant A |  |
 |
Quadrant B |
|---|---|---|---|
| Quadrant D |  |
 |
Quadrant C |
| Plot type | Count rate plots | Images |
|---|---|---|
| Comparison with Poisson distribution Blue bars denote a histogram of data divided into 1 sec bins. Red curve is a Poisson curve with rate = median count rate of data. |
 |
 |
| Quadrant-wise count rates Data is divided into 100 sec bins |
 |
|
| Module-wise count rates for Quadrant A Data is divided into 100 sec bins |
 |
 |
| Module-wise count rates for Quadrant B Data is divided into 100 sec bins |
 |
 |
| Module-wise count rates for Quadrant C Data is divided into 100 sec bins |
 |
 |
| Module-wise count rates for Quadrant D Data is divided into 100 sec bins |
 |
 |
| Parameter | Plot |
|---|---|
| CZT HV Monitor |  |
| D_VDD |  |
| Temperature 1 |  |
| Veto HV Monitor |  |
| Veto LLD |  |
| Alpha Counter |  |
| _CPM_Rate |  |
| CZT Counter |  |
| +2.5 Volts monitor |  |
| +5 Volts monitor |  |
| _ROLL_ROT |  |
| _Roll_DEC |  |
| _Roll_RA |  |
| Veto Counter |  |