| Param | Original file | Final file |
|---|---|---|
| Filename | modeM0/AS1A12_012T01_9000005554cztM0_level2.fits | modeM0/AS1A12_012T01_9000005554cztM0_level2_quad_clean.evt |
| Size (bytes) | 110,753,280 | 135,365,760 |
| Size | 105.6 MB | 129.1 MB |
| Events in quadrant A | 662,500 | 852,452 |
| Events in quadrant B | 636,144 | 853,517 |
| Events in quadrant C | 655,548 | 849,864 |
| Events in quadrant D | 497,800 | 641,986 |
| Mode M9 | |||
|---|---|---|---|
| Quadrant | BADHDUFLAG | Total packets | Discarded packets |
| A | 0 | 41 | 0 |
| B | 0 | 41 | 0 |
| C | 0 | 41 | 0 |
| D | 0 | 41 | 0 |
| Mode SS | |||
|---|---|---|---|
| Quadrant | BADHDUFLAG | Total packets | Discarded packets |
| A | 0 | 266 | 0 |
| B | 0 | 266 | 0 |
| C | 0 | 266 | 0 |
| D | 0 | 266 | 0 |
| Mode M0 | |||
|---|---|---|---|
| Quadrant | BADHDUFLAG | Total packets | Discarded packets |
| A | 0 | 28057 | 0 |
| B | 0 | 29827 | 0 |
| C | 0 | 27327 | 0 |
| D | 0 | 36859 | 0 |
| Quadrant | Total seconds | Saturated seconds | Saturation percentage |
|---|---|---|---|
| A | 13044 | 41 | 0.314321% |
| B | 13044 | 141 | 1.080957% |
| C | 13044 | 81 | 0.620975% |
| D | 13044 | 2523 | 19.342226% |
Noise dominated data is calculated using 1-second bins in cleaned event files. If a bin has >2000 counts, and if more than 50% of those come from <1% of pixels, then it is considered to be noise-dominated and hence unusable.
| Quadrant | # 1 sec bins | Bins with >0 counts | Bins with >2000 counts | High rate bins dominated by noise | Noise dominated (total time) | Noise dominated (detector-on time) | Marked lightcurve |
|---|---|---|---|---|---|---|---|
| A | 17041 | 13039 | 0 | 0 | 0.00% | 0.00% | 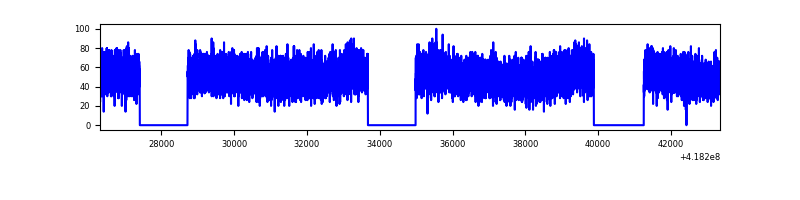 |
| B | 17041 | 13044 | 0 | 0 | 0.00% | 0.00% | 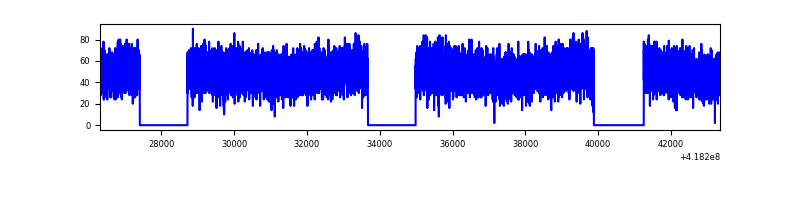 |
| C | 17041 | 13042 | 0 | 0 | 0.00% | 0.00% | 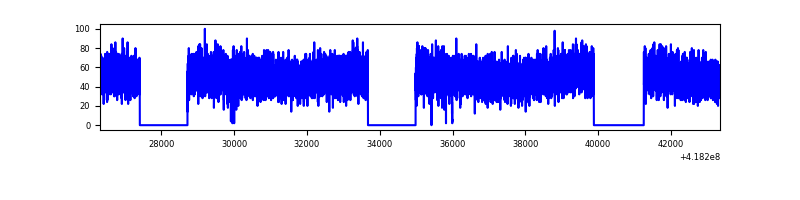 |
| D | 17040 | 12958 | 0 | 0 | 0.00% | 0.00% | 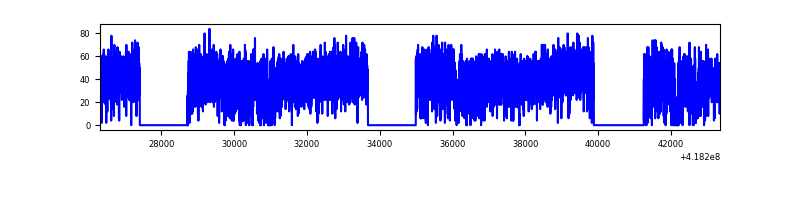 |
Top three noisy pixels from each quadrant. If the there are fewer than three noisy pixels in the level2.evt file, extra rows are filled as -1
| Pixel properties | Quadrant properties | ||||||
|---|---|---|---|---|---|---|---|
| Quadrant | DetID | PixID | Counts | Sigma | Mean | Median | Sigma |
| A | 9 | 19 | 579 | 9.11 | 172 | 162 | 45.8 |
| A | 0 | 29 | 567 | 8.85 | 172 | 162 | 45.8 |
| A | 7 | 110 | 541 | 8.28 | 172 | 162 | 45.8 |
| B | 2 | 9 | 533 | 10.81 | 168 | 160 | 34.5 |
| B | 3 | 17 | 475 | 9.13 | 168 | 160 | 34.5 |
| B | 2 | 8 | 472 | 9.04 | 168 | 160 | 34.5 |
| C | 1 | 81 | 553 | 8.46 | 173 | 161 | 46.4 |
| C | 1 | 80 | 551 | 8.41 | 173 | 161 | 46.4 |
| C | 3 | 203 | 537 | 8.11 | 173 | 161 | 46.4 |
| D | 10 | 189 | 390 | 5.91 | 144 | 131 | 43.9 |
| D | 10 | 113 | 387 | 5.84 | 144 | 131 | 43.9 |
| D | 7 | 3 | 387 | 5.84 | 144 | 131 | 43.9 |
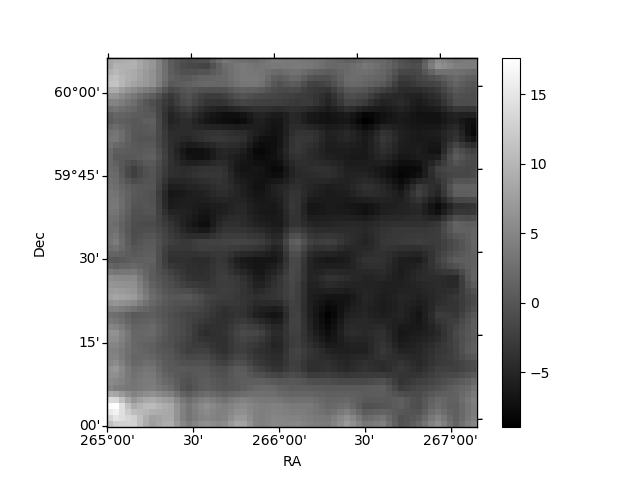
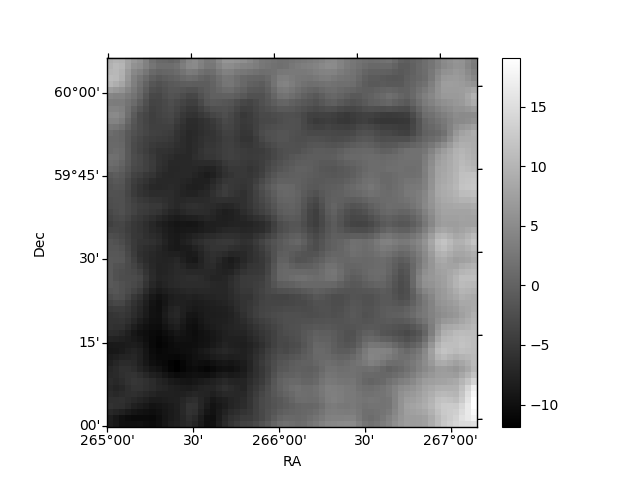
Histogram calculated using DETX and DETY for each event in the final _common_clean file
| Quadrant A | 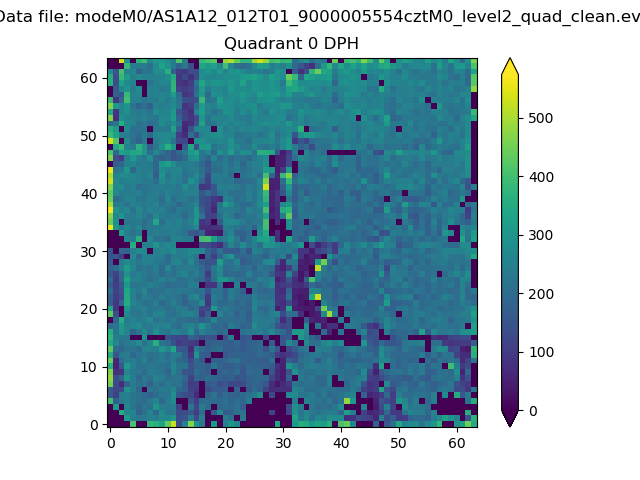 |
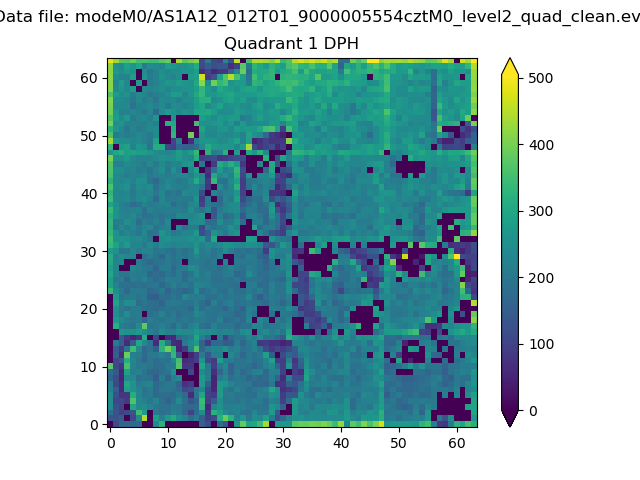 |
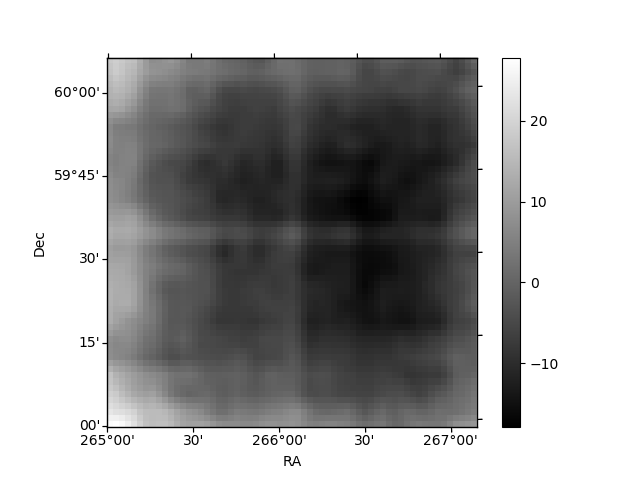
Quadrant B |
|---|---|---|---|
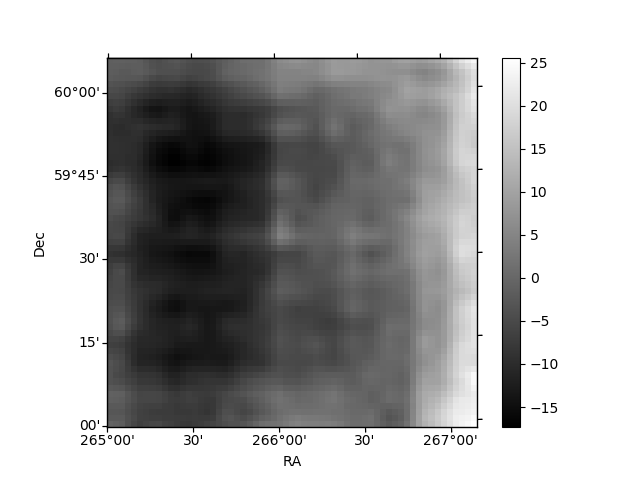
| Quadrant D | 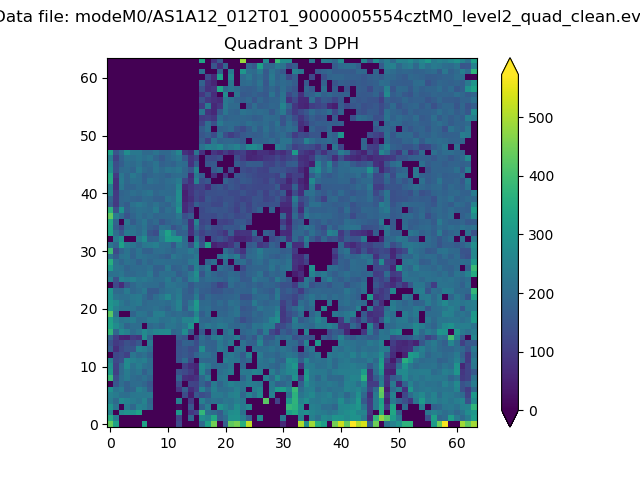 |
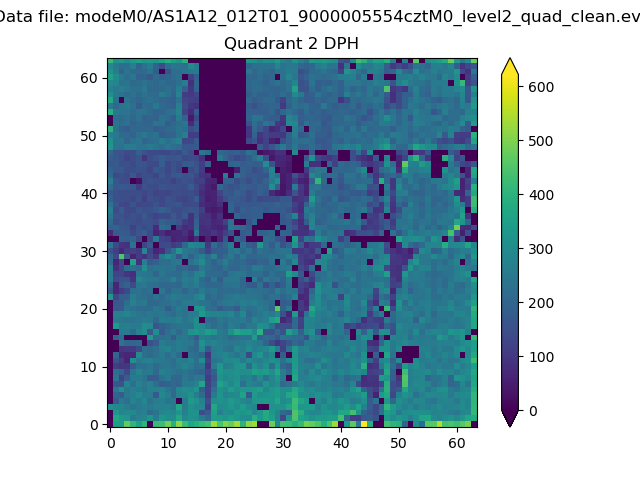 |
Quadrant C |
| Plot type | Count rate plots | Images |
|---|---|---|
| Comparison with Poisson distribution Blue bars denote a histogram of data divided into 1 sec bins. Red curve is a Poisson curve with rate = median count rate of data. |
 |
 |
| Quadrant-wise count rates Data is divided into 100 sec bins |
 |
|
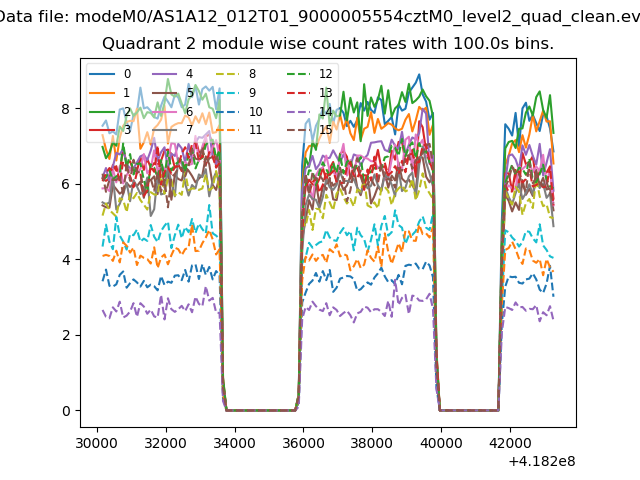
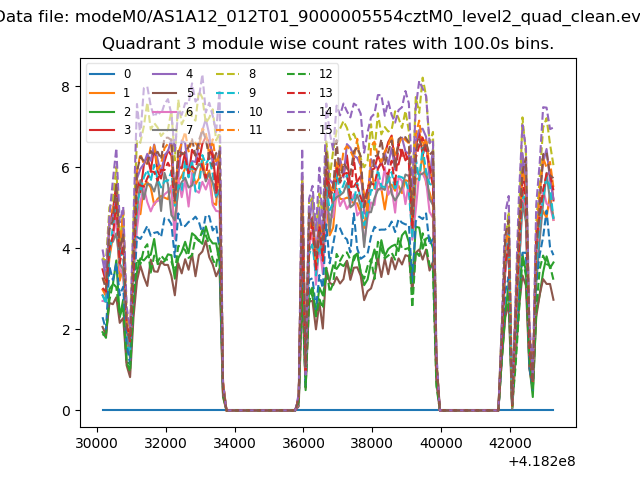
| Module-wise count rates for Quadrant A Data is divided into 100 sec bins |
 |
 |
| Module-wise count rates for Quadrant B Data is divided into 100 sec bins |
 |
 |
| Module-wise count rates for Quadrant C Data is divided into 100 sec bins |
 |
 |
| Module-wise count rates for Quadrant D Data is divided into 100 sec bins |
 |
 |
| Parameter | Plot |
|---|---|
| CZT HV Monitor |  |
| D_VDD | 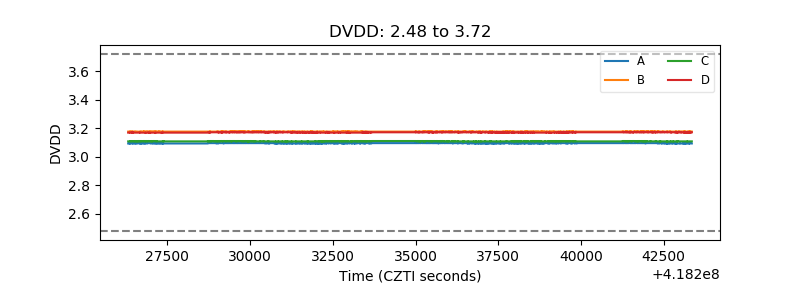 |
| Temperature 1 | 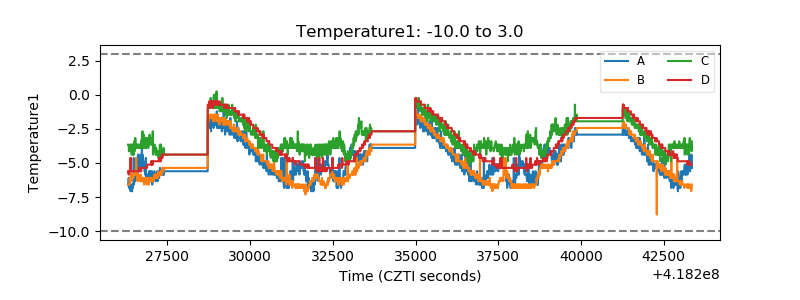 |
| Veto HV Monitor | 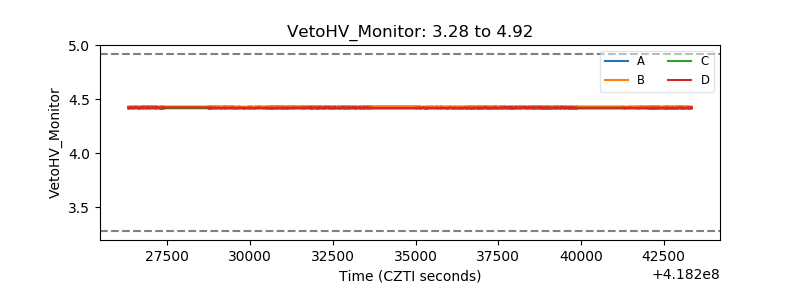 |
| Veto LLD |  |
| Alpha Counter | 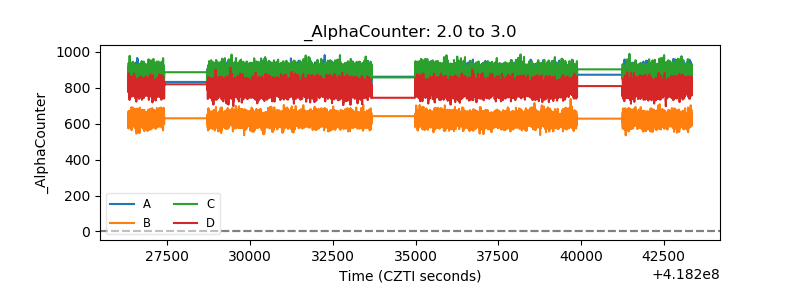 |
| _CPM_Rate | 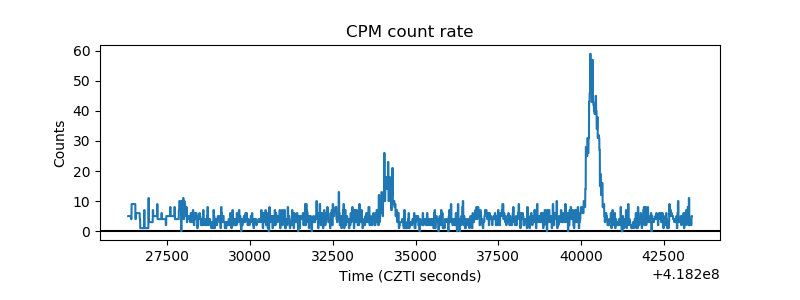 |
| CZT Counter | 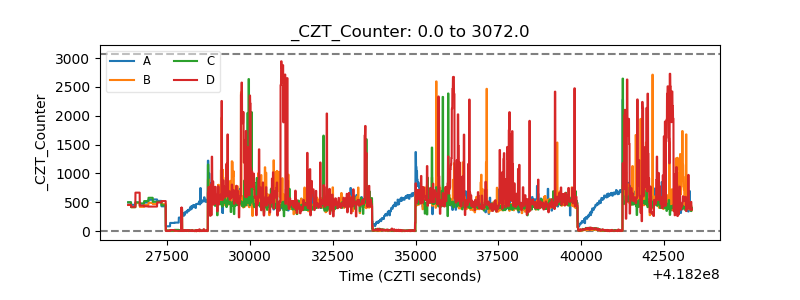 |
| +2.5 Volts monitor | 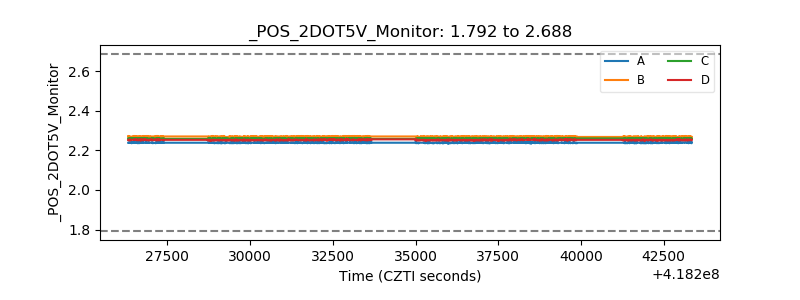 |
| +5 Volts monitor | 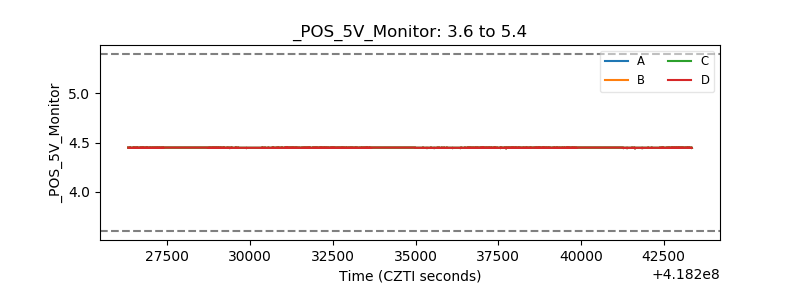 |
| _ROLL_ROT | 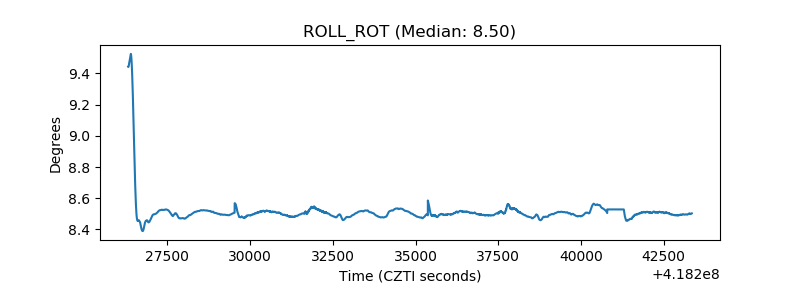 |
| _Roll_DEC |  |
| _Roll_RA | 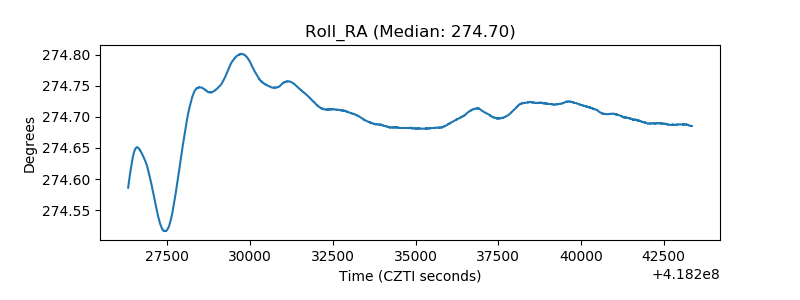 |
| Veto Counter |  |