| Param | Original file | Final file |
|---|---|---|
| Filename | modeM0/AS1A12_029T02_9000005558cztM0_level2.fits | modeM0/AS1A12_029T02_9000005558cztM0_level2_quad_clean.evt |
| Size (bytes) | 2,081,986,560 | 2,328,036,480 |
| Size | 1.9 GB | 2.2 GB |
| Events in quadrant A | 12,748,002 | 14,401,546 |
| Events in quadrant B | 12,240,884 | 14,594,621 |
| Events in quadrant C | 12,023,226 | 13,301,084 |
| Events in quadrant D | 9,691,775 | 11,884,350 |
| Mode M0 | |||
|---|---|---|---|
| Quadrant | BADHDUFLAG | Total packets | Discarded packets |
| A | 0 | 518870 | 0 |
| B | 0 | 538794 | 0 |
| C | 0 | 748629 | 0 |
| D | 0 | 584045 | 0 |
| Mode M9 | |||
|---|---|---|---|
| Quadrant | BADHDUFLAG | Total packets | Discarded packets |
| A | 0 | 916 | 0 |
| B | 0 | 916 | 0 |
| C | 0 | 916 | 0 |
| D | 0 | 913 | 0 |
| Mode SS | |||
|---|---|---|---|
| Quadrant | BADHDUFLAG | Total packets | Discarded packets |
| A | 0 | 4877 | 0 |
| B | 0 | 4886 | 0 |
| C | 0 | 4880 | 0 |
| D | 0 | 4875 | 0 |
| Quadrant | Total seconds | Saturated seconds | Saturation percentage |
|---|---|---|---|
| A | 238401 | 912 | 0.382549% |
| B | 238367 | 2957 | 1.240524% |
| C | 238013 | 18454 | 7.753358% |
| D | 238392 | 33619 | 14.102403% |
Noise dominated data is calculated using 1-second bins in cleaned event files. If a bin has >2000 counts, and if more than 50% of those come from <1% of pixels, then it is considered to be noise-dominated and hence unusable.
| Quadrant | # 1 sec bins | Bins with >0 counts | Bins with >2000 counts | High rate bins dominated by noise | Noise dominated (total time) | Noise dominated (detector-on time) | Marked lightcurve |
|---|---|---|---|---|---|---|---|
| A | 339940 | 239038 | 0 | 0 | 0.00% | 0.00% | 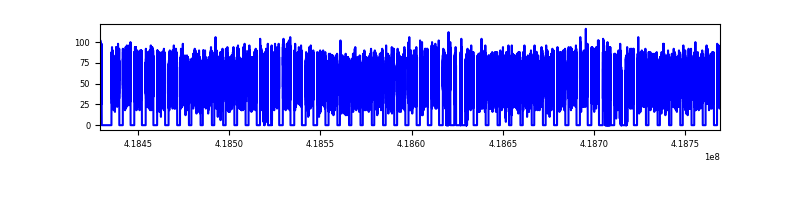 |
| B | 339940 | 238972 | 0 | 0 | 0.00% | 0.00% | 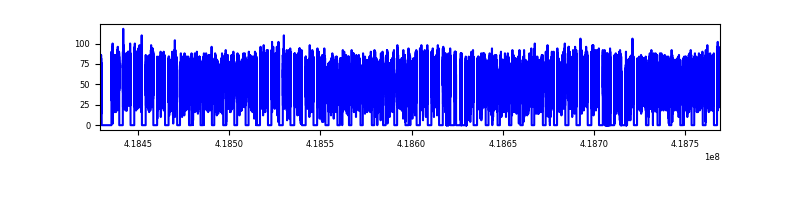 |
| C | 339941 | 238462 | 0 | 0 | 0.00% | 0.00% |  |
| D | 339941 | 236579 | 0 | 0 | 0.00% | 0.00% | 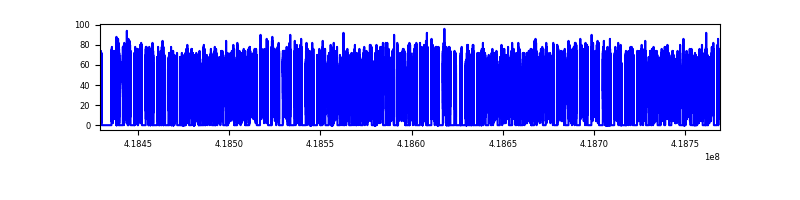 |
Top three noisy pixels from each quadrant. If the there are fewer than three noisy pixels in the level2.evt file, extra rows are filled as -1
| Pixel properties | Quadrant properties | ||||||
|---|---|---|---|---|---|---|---|
| Quadrant | DetID | PixID | Counts | Sigma | Mean | Median | Sigma |
| A | 7 | 110 | 10531 | 8.89 | 3323 | 3104 | 835.3 |
| A | 9 | 19 | 10412 | 8.75 | 3323 | 3104 | 835.3 |
| A | 0 | 29 | 10276 | 8.59 | 3323 | 3104 | 835.3 |
| B | 2 | 9 | 10592 | 12.1 | 3236 | 3087 | 620.5 |
| B | 3 | 80 | 8927 | 9.41 | 3236 | 3087 | 620.5 |
| B | 2 | 8 | 8564 | 8.83 | 3236 | 3087 | 620.5 |
| C | 1 | 81 | 9657 | 8.21 | 3178 | 2970 | 814.2 |
| C | 3 | 202 | 9437 | 7.94 | 3178 | 2970 | 814.2 |
| C | 1 | 80 | 9347 | 7.83 | 3178 | 2970 | 814.2 |
| D | 7 | 3 | 7497 | 6.01 | 2818 | 2557 | 821.7 |
| D | 10 | 189 | 7453 | 5.96 | 2818 | 2557 | 821.7 |
| D | 6 | 67 | 7292 | 5.76 | 2818 | 2557 | 821.7 |
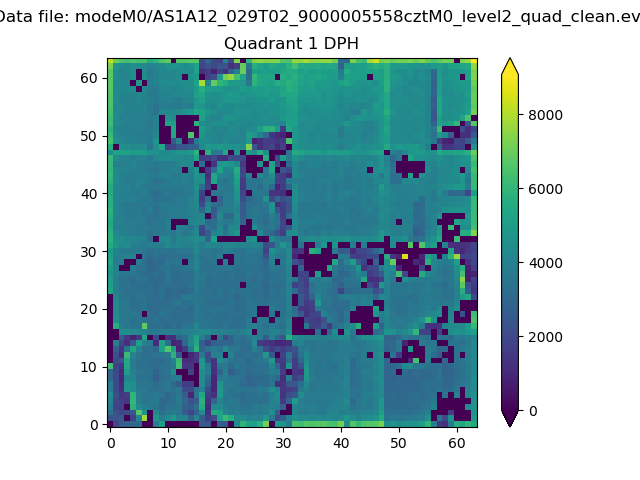
Histogram calculated using DETX and DETY for each event in the final _common_clean file
| Quadrant A | 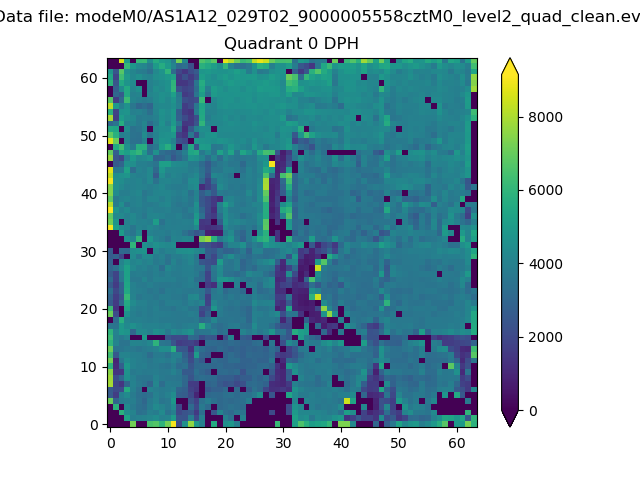 |
 |
Quadrant B |
|---|---|---|---|
| Quadrant D | 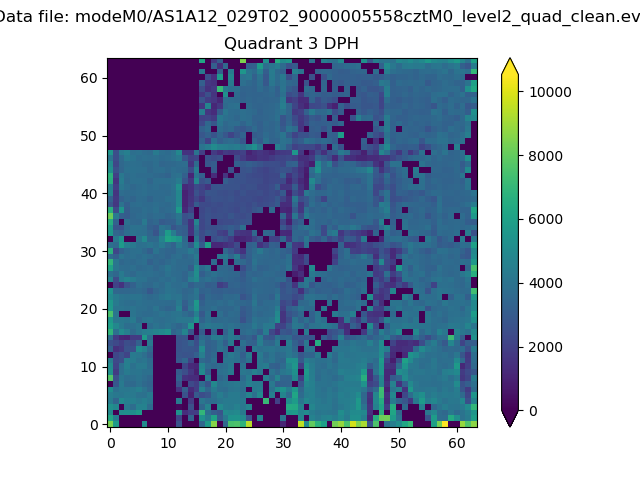 |
 |
Quadrant C |
| Plot type | Count rate plots | Images |
|---|---|---|
| Comparison with Poisson distribution Blue bars denote a histogram of data divided into 1 sec bins. Red curve is a Poisson curve with rate = median count rate of data. |
 |
 |
| Quadrant-wise count rates Data is divided into 100 sec bins |
 |
|
| Module-wise count rates for Quadrant A Data is divided into 100 sec bins |
 |
 |
| Module-wise count rates for Quadrant B Data is divided into 100 sec bins |
 |
 |
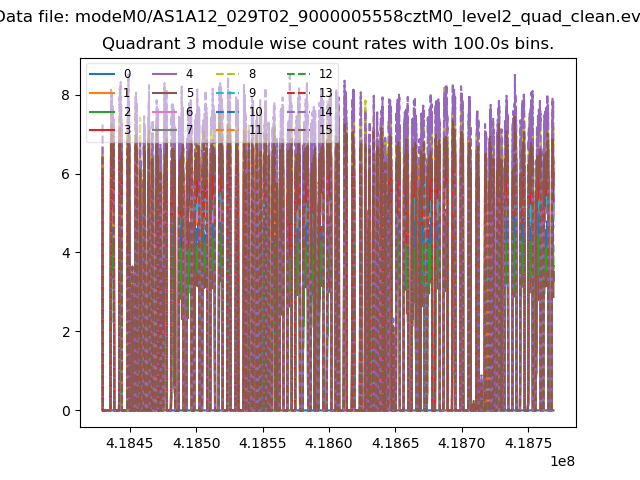
| Module-wise count rates for Quadrant C Data is divided into 100 sec bins |
 |
 |
| Module-wise count rates for Quadrant D Data is divided into 100 sec bins |
 |
 |
| Parameter | Plot |
|---|---|
| CZT HV Monitor |  |
| D_VDD |  |
| Temperature 1 | 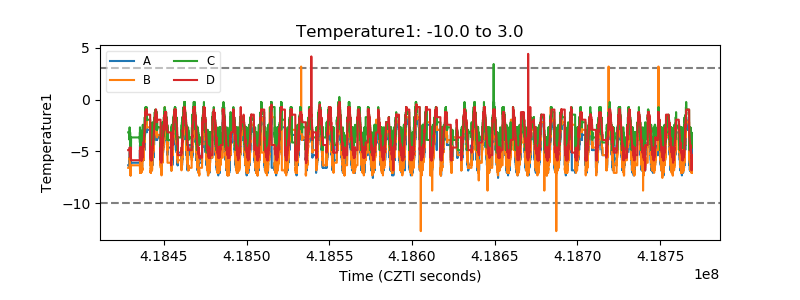 |
| Veto HV Monitor |  |
| Veto LLD | 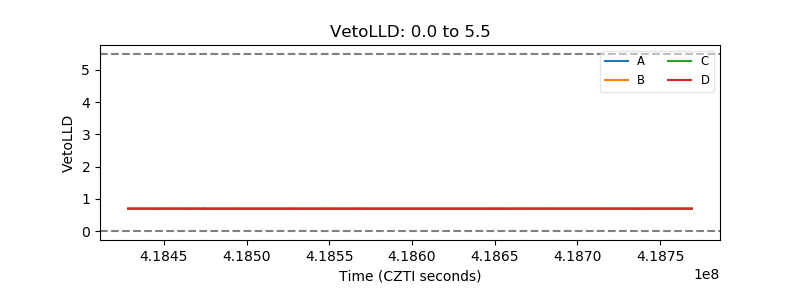 |
| Alpha Counter |  |
| _CPM_Rate | 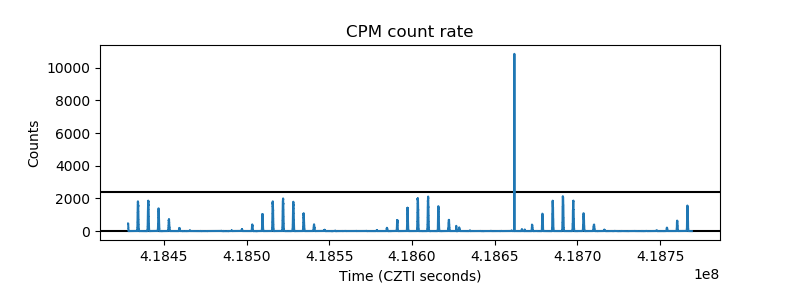 |
| CZT Counter |  |
| +2.5 Volts monitor |  |
| +5 Volts monitor | 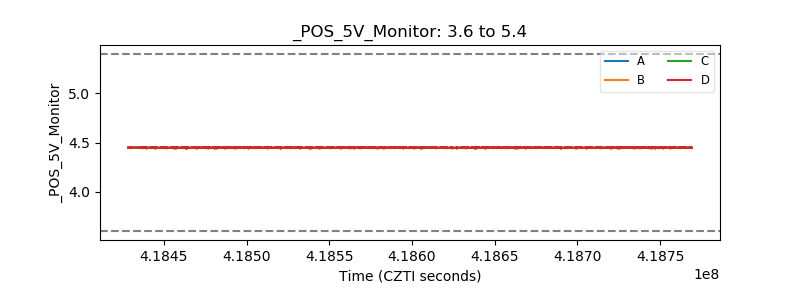 |
| _ROLL_ROT | 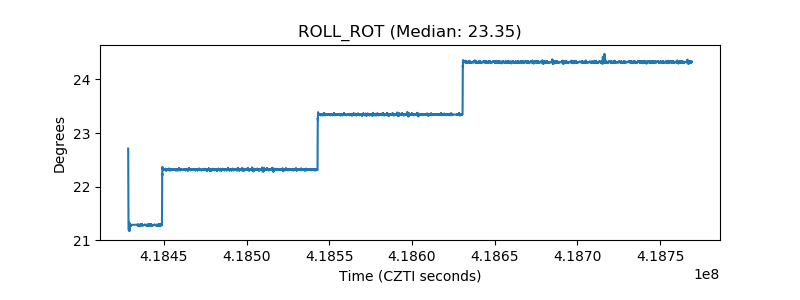 |
| _Roll_DEC | 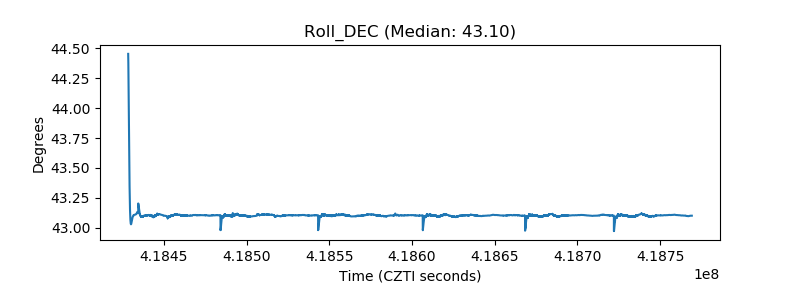 |
| _Roll_RA | 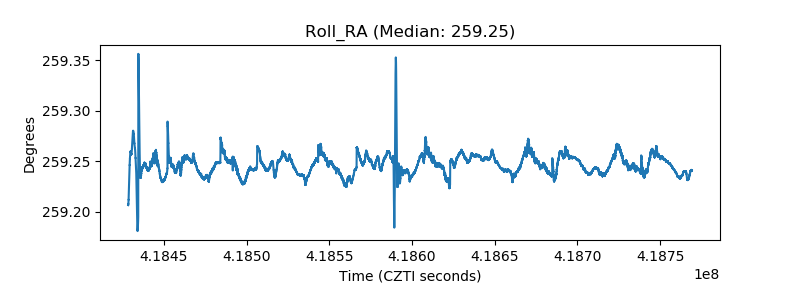 |
| Veto Counter | 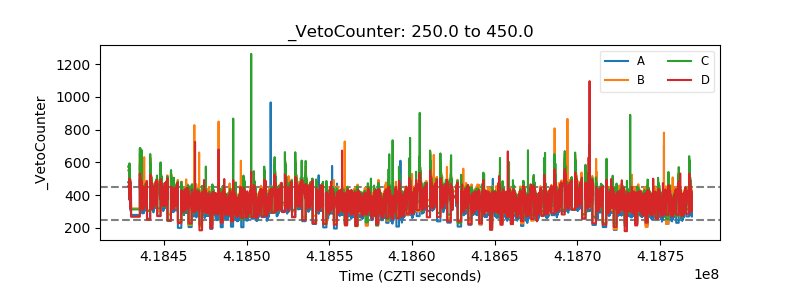 |