| Param | Original file | Final file |
|---|---|---|
| Filename | modeM0/AS1A12_042T01_9000005560cztM0_level2.fits | modeM0/AS1A12_042T01_9000005560cztM0_level2_quad_clean.evt |
| Size (bytes) | 281,352,960 | 390,263,040 |
| Size | 268.3 MB | 372.2 MB |
| Events in quadrant A | 1,740,786 | 2,666,243 |
| Events in quadrant B | 1,685,720 | 2,723,612 |
| Events in quadrant C | 1,583,970 | 2,248,924 |
| Events in quadrant D | 1,307,258 | 1,981,043 |
| Mode M0 | |||
|---|---|---|---|
| Quadrant | BADHDUFLAG | Total packets | Discarded packets |
| A | 0 | 69008 | 0 |
| B | 0 | 69747 | 0 |
| C | 0 | 123432 | 0 |
| D | 0 | 74797 | 0 |
| Mode M9 | |||
|---|---|---|---|
| Quadrant | BADHDUFLAG | Total packets | Discarded packets |
| A | 0 | 142 | 0 |
| B | 0 | 142 | 0 |
| C | 0 | 142 | 0 |
| D | 0 | 143 | 0 |
| Mode SS | |||
|---|---|---|---|
| Quadrant | BADHDUFLAG | Total packets | Discarded packets |
| A | 0 | 654 | 0 |
| B | 0 | 654 | 0 |
| C | 0 | 654 | 0 |
| D | 0 | 654 | 0 |
| Quadrant | Total seconds | Saturated seconds | Saturation percentage |
|---|---|---|---|
| A | 31999 | 71 | 0.221882% |
| B | 32001 | 191 | 0.596856% |
| C | 31999 | 4512 | 14.100441% |
| D | 32001 | 5099 | 15.933877% |
Noise dominated data is calculated using 1-second bins in cleaned event files. If a bin has >2000 counts, and if more than 50% of those come from <1% of pixels, then it is considered to be noise-dominated and hence unusable.
| Quadrant | # 1 sec bins | Bins with >0 counts | Bins with >2000 counts | High rate bins dominated by noise | Noise dominated (total time) | Noise dominated (detector-on time) | Marked lightcurve |
|---|---|---|---|---|---|---|---|
| A | 51132 | 31999 | 0 | 0 | 0.00% | 0.00% |  |
| B | 51132 | 31999 | 0 | 0 | 0.00% | 0.00% | 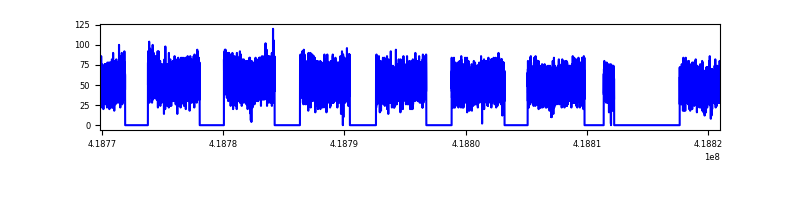 |
| C | 51132 | 31957 | 0 | 0 | 0.00% | 0.00% | 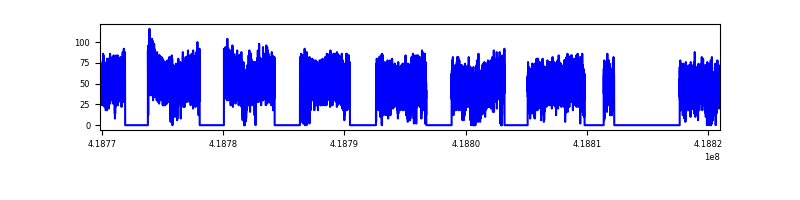 |
| D | 51132 | 31831 | 0 | 0 | 0.00% | 0.00% | 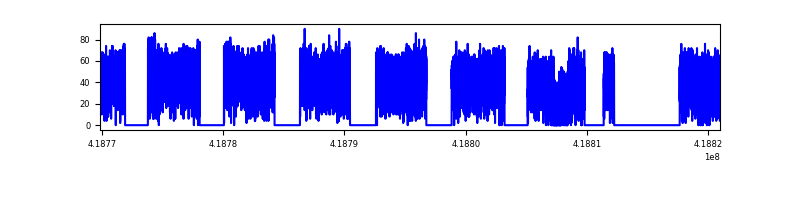 |
Top three noisy pixels from each quadrant. If the there are fewer than three noisy pixels in the level2.evt file, extra rows are filled as -1
| Pixel properties | Quadrant properties | ||||||
|---|---|---|---|---|---|---|---|
| Quadrant | DetID | PixID | Counts | Sigma | Mean | Median | Sigma |
| A | 9 | 19 | 1508 | 9.38 | 454 | 427 | 115.2 |
| A | 0 | 29 | 1455 | 8.92 | 454 | 427 | 115.2 |
| A | 7 | 110 | 1371 | 8.19 | 454 | 427 | 115.2 |
| B | 2 | 9 | 1493 | 12.29 | 446 | 428 | 86.7 |
| B | 3 | 80 | 1225 | 9.19 | 446 | 428 | 86.7 |
| B | 5 | 128 | 1193 | 8.83 | 446 | 428 | 86.7 |
| C | 1 | 81 | 1350 | 8.83 | 418 | 393 | 108.4 |
| C | 3 | 203 | 1269 | 8.08 | 418 | 393 | 108.4 |
| C | 1 | 80 | 1263 | 8.02 | 418 | 393 | 108.4 |
| D | 10 | 189 | 1071 | 6.44 | 380 | 345 | 112.7 |
| D | 6 | 62 | 1009 | 5.89 | 380 | 345 | 112.7 |
| D | 10 | 113 | 1000 | 5.81 | 380 | 345 | 112.7 |
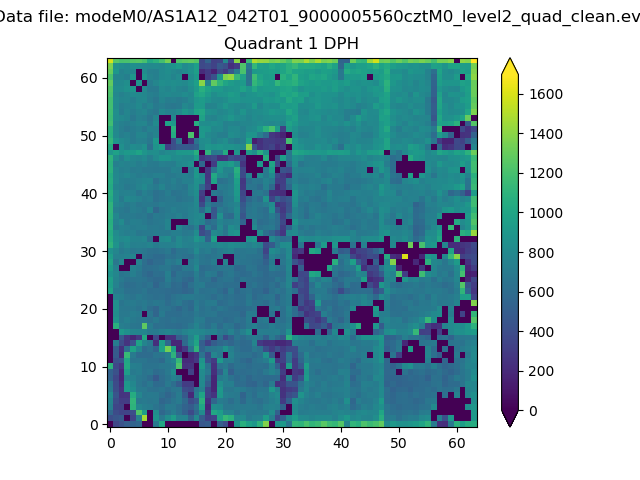
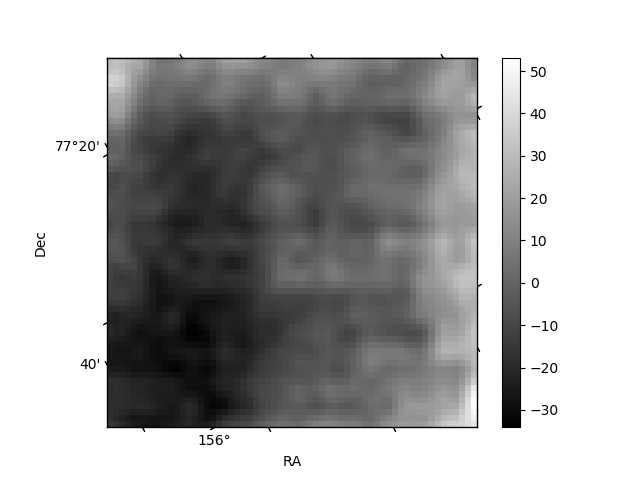
Histogram calculated using DETX and DETY for each event in the final _common_clean file
| Quadrant A |  |
 |
Quadrant B |
|---|---|---|---|
| Quadrant D |  |
 |
Quadrant C |
| Plot type | Count rate plots | Images |
|---|---|---|
| Comparison with Poisson distribution Blue bars denote a histogram of data divided into 1 sec bins. Red curve is a Poisson curve with rate = median count rate of data. |
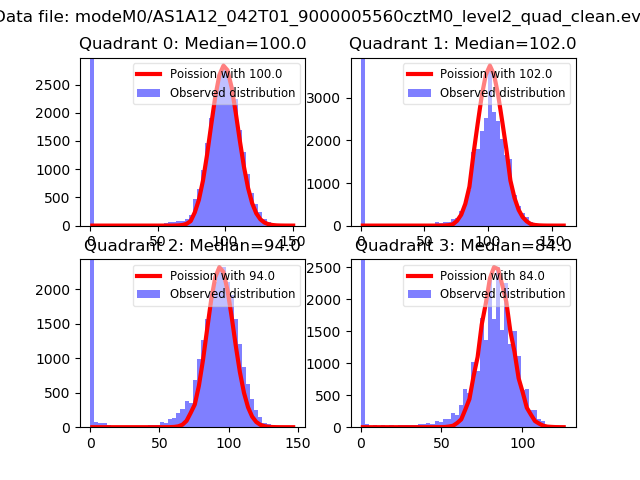 |
 |
| Quadrant-wise count rates Data is divided into 100 sec bins |
 |
|
| Module-wise count rates for Quadrant A Data is divided into 100 sec bins |
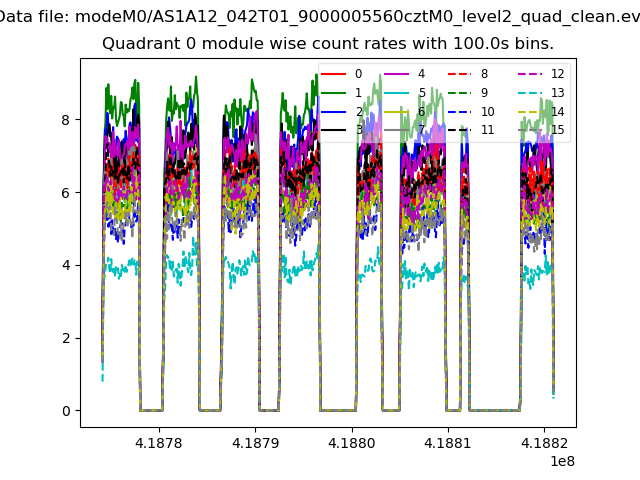 |
 |
| Module-wise count rates for Quadrant B Data is divided into 100 sec bins |
 |
 |
| Module-wise count rates for Quadrant C Data is divided into 100 sec bins |
 |
 |
| Module-wise count rates for Quadrant D Data is divided into 100 sec bins |
 |
 |
| Parameter | Plot |
|---|---|
| CZT HV Monitor |  |
| D_VDD | 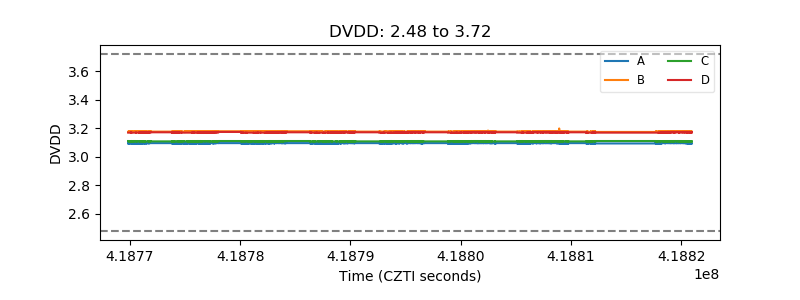 |
| Temperature 1 | 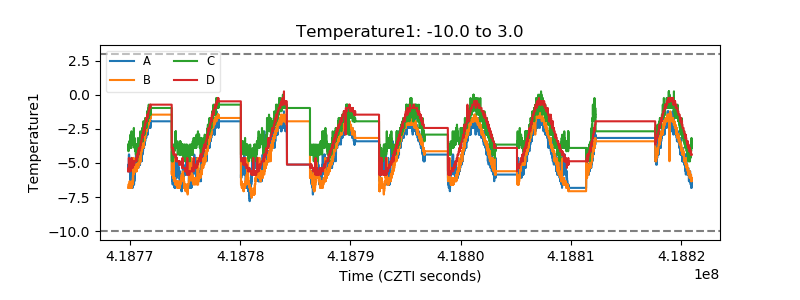 |
| Veto HV Monitor | 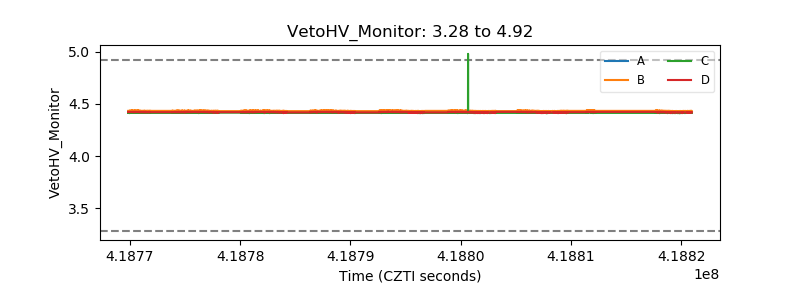 |
| Veto LLD | 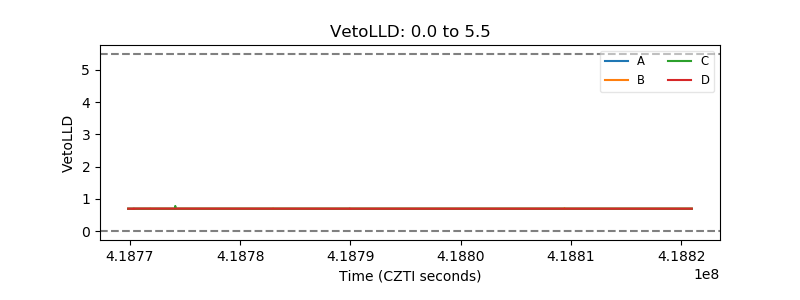 |
| Alpha Counter |  |
| _CPM_Rate |  |
| CZT Counter | 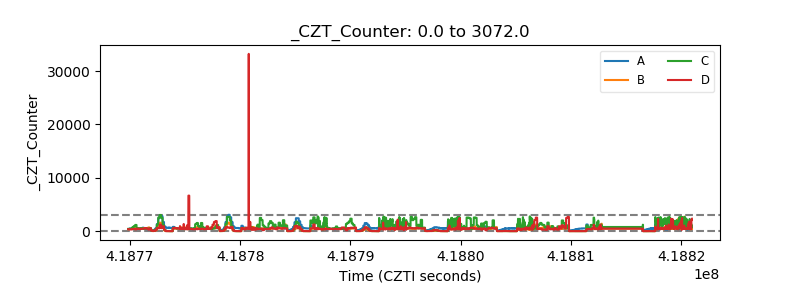 |
| +2.5 Volts monitor |  |
| +5 Volts monitor |  |
| _ROLL_ROT |  |
| _Roll_DEC |  |
| _Roll_RA |  |
| Veto Counter | 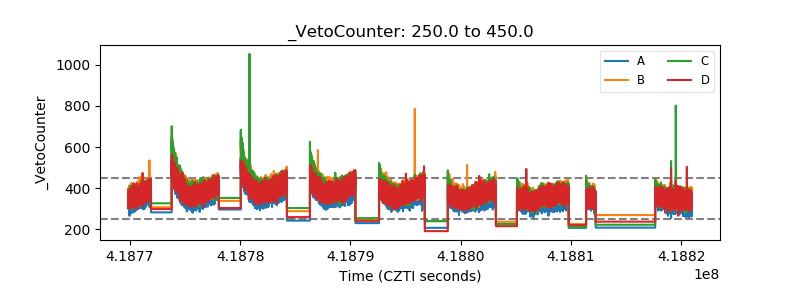 |